- 3 Closing Prices A Raw Stock Prices From Three Different Sources Are Given Prices Might Be Missing For Some Days For S 1 (279.77 KiB) Viewed 31 times
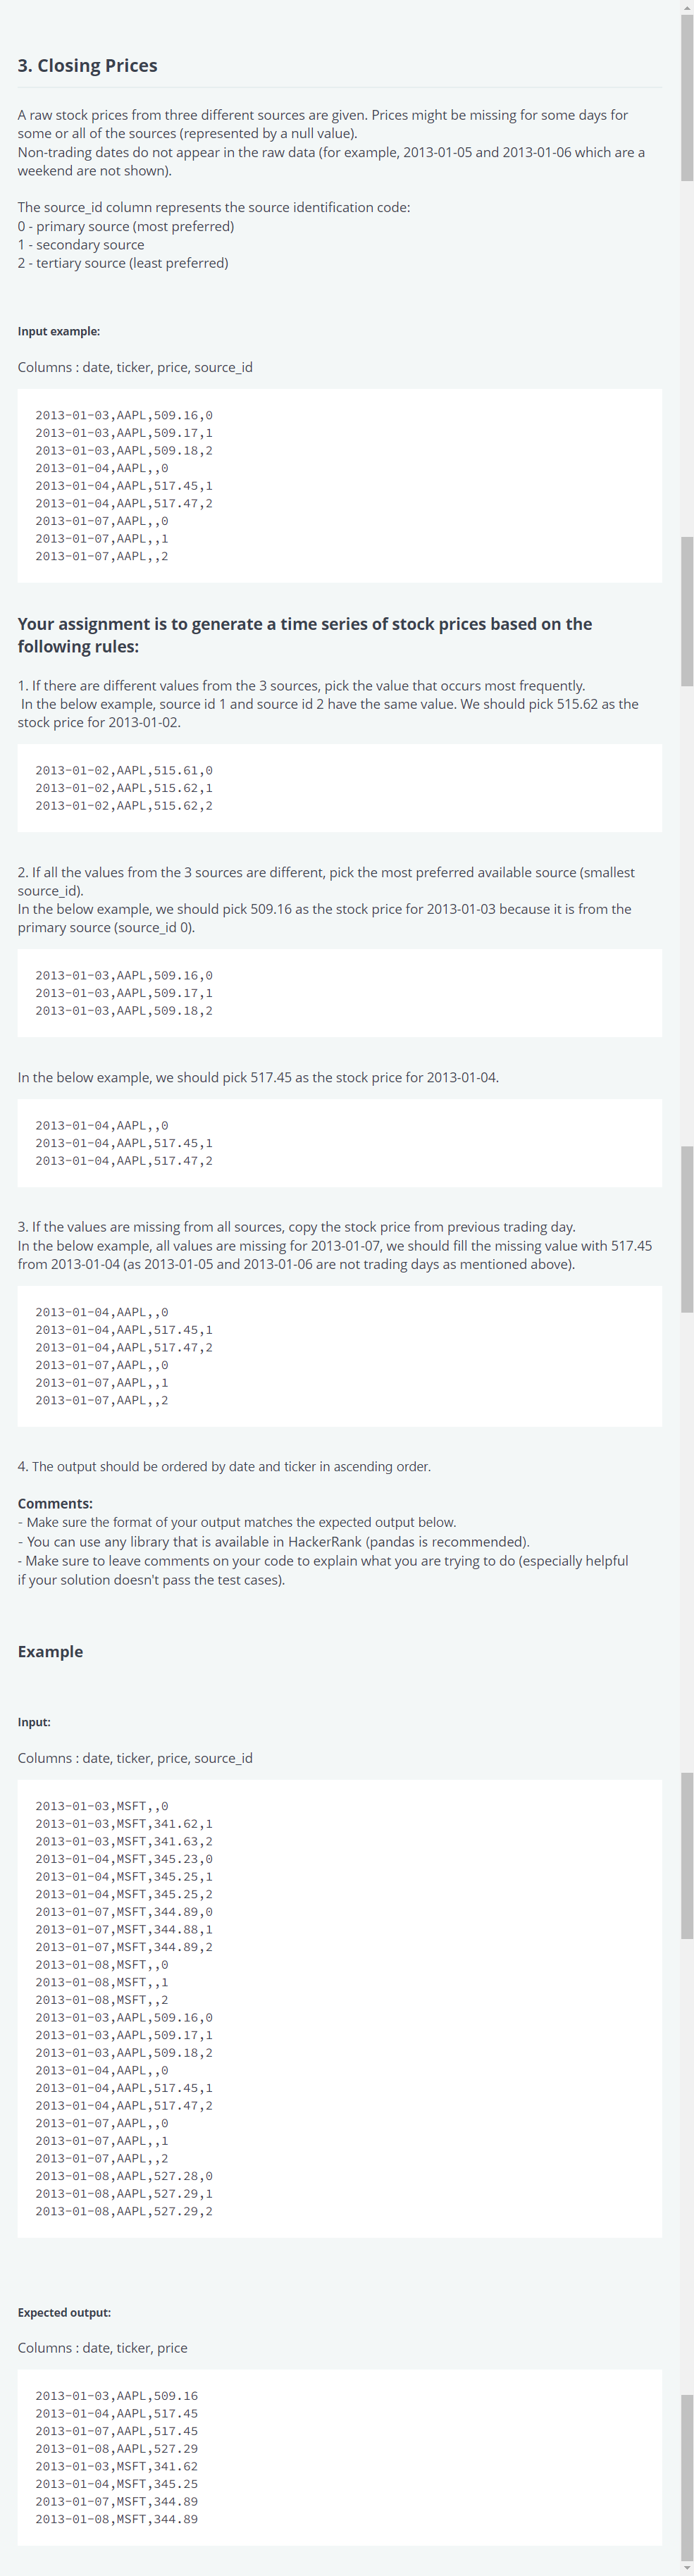
3. Closing Prices A raw stock prices from three different sources are given. Prices might be missing for some days for some or all of the sources (represented by a null value). Non-trading dates do not appear in the raw data (for example, 2013-01-05 and 2013-01-06 which are a weekend are not shown). The source_id column represents the source identification code: 0 - primary source (most preferred) 1 - secondary source 2 - tertiary source (least preferred) Input example: Columns : date, ticker, price, source_id 2013-01-03, AAPL, 509.16,0 2013-01-03, AAPL, 509.17, 1 2013-01-03, AAPL, 509.18, 2 2013-01-04, AAPL, , 0 2013-01-04, AAPL, 517.45,1 2013-01-04, AAPL, 517.47,2 2013-01-07, AAPL, ,0 2013-01-07, AAPL, , 1 2013-01-07, AAPL, , 2 Your assignment is to generate a time series of stock prices based on the following rules: 1. If there are different values from the 3 sources, pick the value that occurs most frequently. In the below example, source id 1 and source id 2 have the same value. We should pick 515.62 as the stock price for 2013-01-02. 2013-01-02, AAPL, 515.61,0 2013-01-02, AAPL, 515.62,1 2013-01-02, AAPL, 515.62,2 2. If all the values from the 3 sources are different, pick the most preferred available source (smallest source_id). In the below example, we should pick 509.16 as the stock price for 2013-01-03 because it is from the primary source (source_id 0). 2013-01-03, AAPL, 509.16,0 2013-01-03, AAPL, 509.17, 1 2013-01-03, AAPL, 509.18,2 In the below example, we should pick 517.45 as the stock price for 2013-01-04. 2013-01-04, AAPL, , 0 2013-01-04, AAPL, 517.45, 1 2013-01-04, AAPL, 517.47,2 3. If the values are missing from all sources, copy the stock price from previous trading day. In the below example, all values are missing for 2013-01-07, we should fill the missing value with 517.45 from 2013-01-04 (as 2013-01-05 and 2013-01-06 are not trading days as mentioned above). 2013-01-04, AAPL, ,0 2013-01-04, AAPL, 517.45, 1 2013-01-04, AAPL, 517.47,2 2013-01-07, AAPL,, 0 2013-01-07, AAPL, , 1 2013-01-07, AAPL, , 2 4. The output should be ordered by date and ticker in ascending order. Comments: - Make sure the format of your output matches the expected output below. - You can use any library that is available in HackerRank (pandas is recommended). - Make sure to leave comments on your code to explain what you are trying to do (especially helpful if your solution doesn't pass the test cases). Example Input: Columns : date, ticker, price, source_id 2013-01-03, MSFT,, 0 2013-01-03, MSFT, 341.62,1 2013-01-03, MSFT, 341.63,2 2013-01-04, MSFT, 345.23,0 2013-01-04, MSFT, 345.25,1 2013-01-04, MSFT, 345.25,2 2013-01-07, MSFT, 344.89,0 2013-01-07, MSFT, 344.88, 1 2013-01-07, MSFT, 344.89,2 2013-01-08, MSFT,, 0 2013-01-08, MSFT,, 1 2013-01-08, MSFT,,2 2013-01-03, AAPL, 509.16,0 2013-01-03, AAPL, 509.17,1 2013-01-03, AAPL, 509.18,2 2013-01-04, AAPL, ,0 2013-01-04, AAPL, 517.45, 1 2013-01-04, AAPL, 517.47,2 2013-01-07, AAPL, , 0 2013-01-07, AAPL, , 1 2013-01-07, AAPL, , 2 2013-01-08, AAPL, 527.28,0 2013-01-08, AAPL, 527.29, 1 2013-01-08, AAPL, 527.29,2 Expected output: Columns : date, ticker, price 2013-01-03, AAPL, 509.16 2013-01-04, AAPL, 517.45 2013-01-07, AAPL, 517.45 2013-01-08, AAPL, 527.29 2013-01-03, MSFT, 341.62 2013-01-04, MSFT, 345.25 2013-01-07, MSFT, 344.89 2013-01-08, MSFT, 344.89