Page 1 of 1
X y 2. Use the least squares regression to fit a straight line to 0 2 6 9 5 6 6 9 4 7 11 8 12 8 15 10 17 12 19 11 Along
Posted: Sun Jul 03, 2022 12:01 pm
by answerhappygod
- X Y 2 Use The Least Squares Regression To Fit A Straight Line To 0 2 6 9 5 6 6 9 4 7 11 8 12 8 15 10 17 12 19 11 Along 1 (38.41 KiB) Viewed 16 times
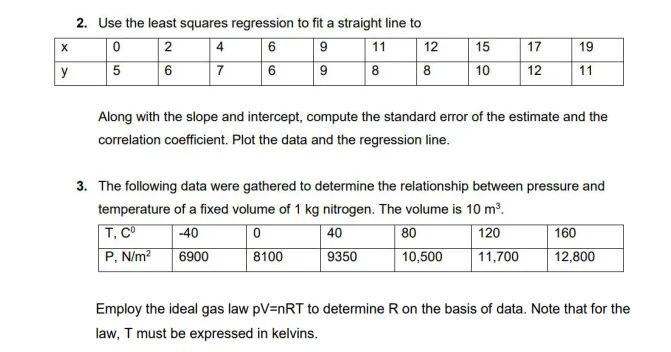
X y 2. Use the least squares regression to fit a straight line to 0 2 6 9 5 6 6 9 4 7 11 8 12 8 15 10 17 12 19 11 Along with the slope and intercept, compute the standard error of the estimate and the correlation coefficient. Plot the data and the regression line. 3. The following data were gathered to determine the relationship between pressure and temperature of a fixed volume of 1 kg nitrogen. The volume is 10 m³. T, CO -40 0 40 80 120 P, N/m² 6900 8100 9350 10,500 11,700 160 12,800 Employ the ideal gas law pV=nRT to determine R on the basis of data. Note that for the law, T must be expressed in kelvins.