- In The Following Pyspark Code Snippet We Generate A Dataset That Is Subsequently Used To Calculate The Mean Squared Err 1 (162.17 KiB) Viewed 13 times
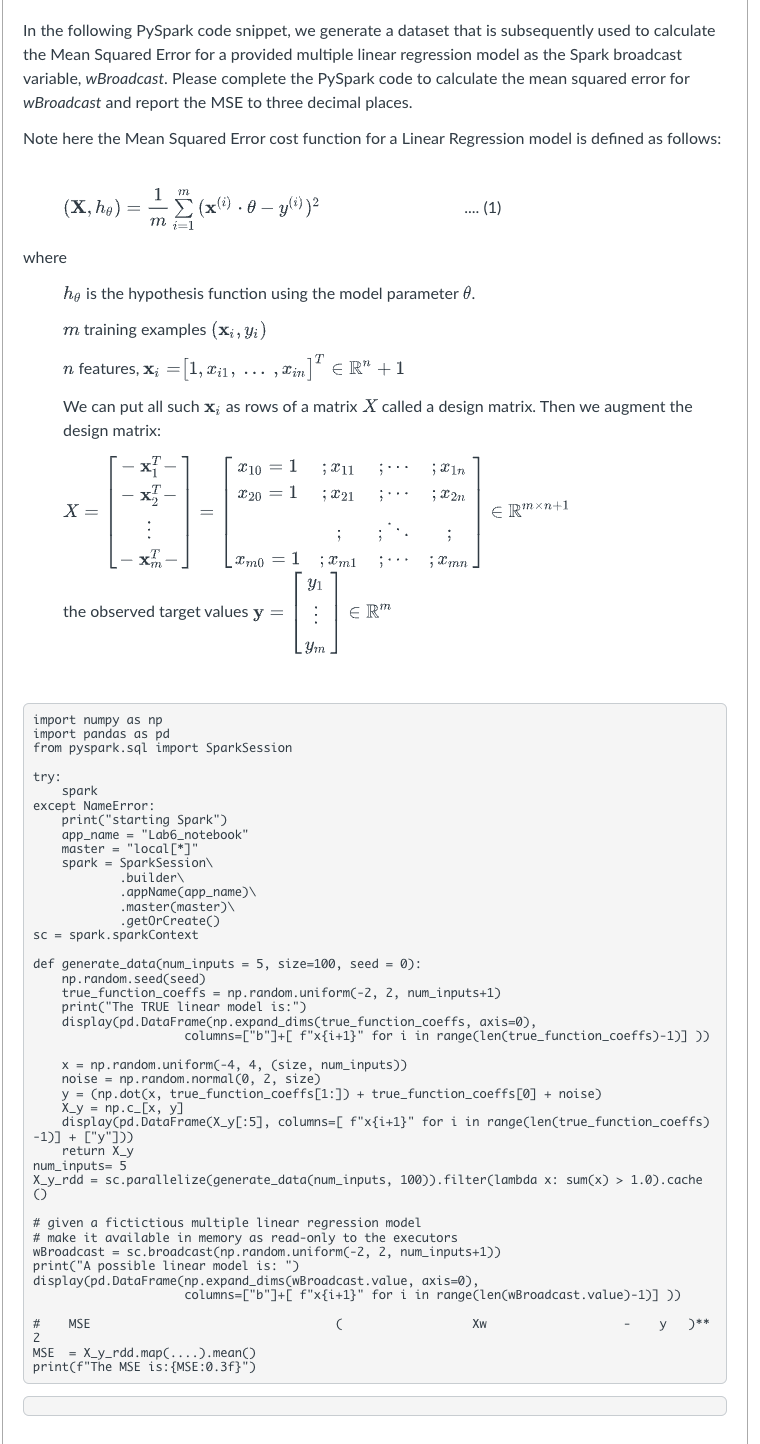
In the following PySpark code snippet, we generate a dataset that is subsequently used to calculate the Mean Squared Error for a provided multiple linear regression model as the Spark broadcast variable, wBroadcast. Please complete the PySpark code to calculate the mean squared error for wBroadcast and report the MSE to three decimal places. Note here the Mean Squared Error cost function for a Linear Regression model is defined as follows: (X, he) = where 1 m X = m i=1 he is the hypothesis function using the model parameter 0. m. training examples (xi, yi) n features, x₁ = [1, il, ..., Lin, # 2 (x(²). A — y(¹))² We can put all such x; as rows of a matrix X called a design matrix. Then we augment the design matrix: XT ⠀ T Xm = SC = sc spark.sparkContext 10 = 1 20 = 1 the observed target values y = import numpy as np import pandas as pd from pyspark.sql import SparkSession try: spark except NameError: Lin]¹ € R¹ +1 Tm0 = 1 print("starting Spark") app_name = "Lab6_notebook" master "local [*]" spark SparkSession\ .builder\ MSE .appName(app_name)\ .master(master)\ .getOrCreate() ; *11 ;21 ; xml Yı : Ym 5*** ***** .... (1) ERm MSE = X_y_rdd.map(....).mean() print(f"The MSE is: {MSE: 0.3f}") def generate_data(num_inputs = 5, size=100, seed = 0): np.random.seed(seed) true_function_coeffs = np.random.uniform(-2, 2, num_inputs+1) ; Iln ; x2n 3- ; ; xmn print("The TRUE linear model is:") display (pd. DataFrame(np.expand_dims(true_function_coeffs, axis=0), # given a fictictious multiple linear regression model # make it available in memory as read-only to the executors columns=["b"]+[ f"x{i+1}" for i in range(len(true_function_coeffs)-1)] >> x = np.random.uniform(-4, 4, (size, num_inputs)) noise = np.random. normal (0, 2, size) y = (np.dot(x, true_function_coeffs [1:]) + true_function_coeffs [0] + noise) X_y np.c_[x, y] display(pd.DataFrame(X_y[:5], columns=[ f"x{i+1}" for i in range(len(true_function_coeffs) -1)] + ["y"])) return X_y num_inputs= 5 X_y_rdd = sc.parallelize(generate_data(num_inputs, 100)).filter(lambda x: sum(x) > 1.0).cache O €]mxn+1 wBroadcast = sc.broadcast(np.random.uniform(-2, 2, num_inputs+1)) print("A possible linear model is: ") display(pd.DataFrame(np.expand_dims (wBroadcast.value, axis=0), columns=["b"]+[ f"x{i+1}" for i in range(len(wBroadcast.value)-1)] >> ( y 3** Xw