Page 1 of 1
Data Table NaCl (%) 0 0 0 0.5 0.5 & 0.5 1 1 1 2 2 2 Plate section 3 0 Hours Eggs (#) 25 36 27 18 24 23 31 26 37 20 19 19
Posted: Sat Jul 02, 2022 9:55 pm
by answerhappygod
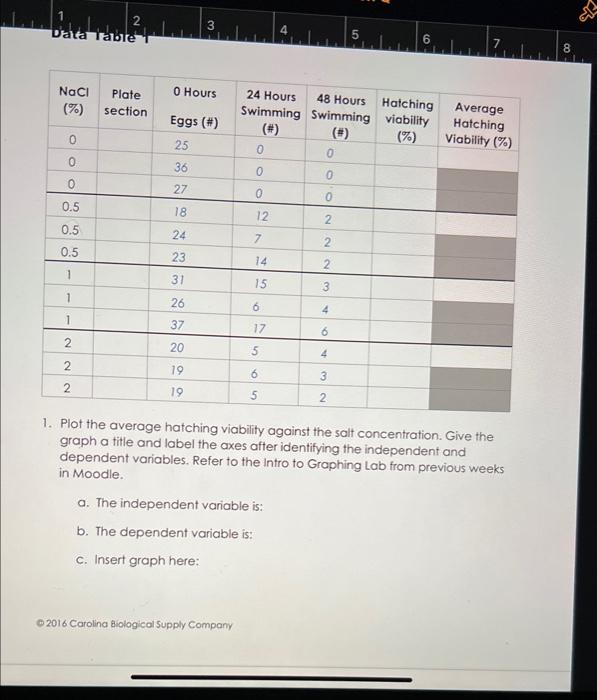
- Data Table Nacl 0 0 0 0 5 0 5 0 5 1 1 1 2 2 2 Plate Section 3 0 Hours Eggs 25 36 27 18 24 23 31 26 37 20 19 19 1 (49.38 KiB) Viewed 16 times
Data Table NaCl (%) 0 0 0 0.5 0.5 & 0.5 1 1 1 2 2 2 Plate section 3 0 Hours Eggs (#) 25 36 27 18 24 23 31 26 37 20 19 19 0 0 © 2016 Carolina Biological Supply
Company 24 Hours 48 Hours Hatching Swimming Swimming viability (%) 0 12 7 14 15 6 17 5 6 5 a. The independent variable is: b. The dependent variable is: c. Insert graph here: 0 0 0 2 2 2 3 4 5 6 4 3 2 6 1 1. Plot the average hatching viability against the salt concentration. Give the graph a title and label the axes after identifying the independent and dependent variables. Refer to the Intro to Graphing Lab from previous weeks in Moodle. Average Hatching Viability (%) 8 HE