- 8 8 Oxygen Evolution Or Uptake Of Contro 100 40 0 1 O D 0 2 0 3 Nacl Mol L D O 0 4 0 5 Caption Increasing Salt 1 (84.52 KiB) Viewed 13 times
- 8 8 Oxygen Evolution Or Uptake Of Contro 100 40 0 1 O D 0 2 0 3 Nacl Mol L D O 0 4 0 5 Caption Increasing Salt 2 (40.83 KiB) Viewed 13 times
- 8 8 Oxygen Evolution Or Uptake Of Contro 100 40 0 1 O D 0 2 0 3 Nacl Mol L D O 0 4 0 5 Caption Increasing Salt 3 (33.71 KiB) Viewed 13 times
- 8 8 Oxygen Evolution Or Uptake Of Contro 100 40 0 1 O D 0 2 0 3 Nacl Mol L D O 0 4 0 5 Caption Increasing Salt 4 (37.55 KiB) Viewed 13 times
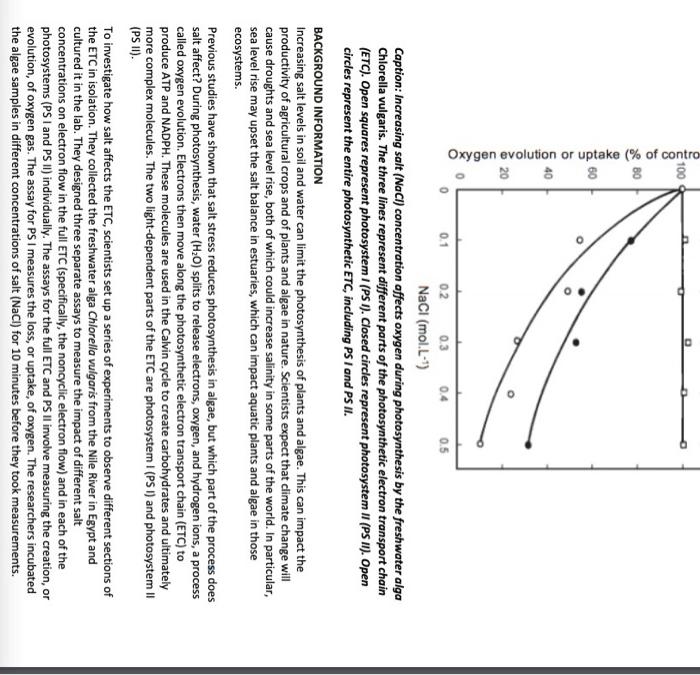
8 8 Oxygen evolution or uptake (% of contro 100 40 0.1 O D ● 0.2 0.3 NaCl (mol.L-¹) D O 0.4 0.5 Caption: Increasing salt (NaCl) concentration affects oxygen during photosynthesis by the freshwater alga Chlorella vulgaris. The three lines represent different parts of the photosynthetic electron transport chain (ETC). Open squares represent photosystem I (PSI). Closed circles represent photosystem II (PS II). Open circles represent the entire photosynthetic ETC, including PS I and PS II. BACKGROUND INFORMATION Increasing salt levels in soil and water can limit the photosynthesis of plants and algae. This can impact the productivity of agricultural crops and of plants and algae in nature. Scientists expect that climate change will cause droughts and sea level rise, both of which could increase salinity in some parts of the world. In particular, sea level rise may upset the salt balance in estuaries, which can impact aquatic plants and algae in those ecosystems. Previous studies have shown that salt stress reduces photosynthesis in algae, but which part of the process does salt affect? During photosynthesis, water (H₂O) splits to release electrons, oxygen, and hydrogen ions, a process called oxygen evolution. Electrons then move along the photosynthetic electron transport chain (ETC) to produce ATP and NADPH. These molecules are used in the Calvin cycle to create carbohydrates and ultimately more complex molecules. The two light-dependent parts of the ETC are photosystem I (PSI) and photosystem II (PS II). To investigate how salt affects the ETC, scientists set up a series of experiments to observe different sections of the ETC in isolation. They collected the freshwater alga Chlorella vulgaris from the Nile River in Egypt and cultured it in the lab. They designed three separate assays to measure the impact of different salt concentrations on electron flow in the full ETC (specifically, the noncyclic electron flow) and in each of the photosystems (PS I and PS II) individually. The assays for the full ETC and PS II involve measuring the creation, or evolution, of oxygen gas. The assay for PS I measures the loss, or uptake, of oxygen. The researchers incubated the algae samples in different concentrations of salt (NaCl) for 10 minutes before they took measurements.
As determined by the measurements for oxygen evolution, what does the figure show for PS I as salt concentration increased? electron transport in PS I decreased with increasing salt concentration electron transport in PS I increased with increasing salt concentration O electron transport in PS I remained the same with increasing salt concentration No answer text provided. O
As determined by the measurements for oxygen evolution, what does the figure show for PS II as salt concentration increased? O No answer text provided. O electron transport in PS II increased O electron transport in PS II remained the same O electron transport in PS II decreased
Freshwater, several hundred feet below ground as in the Soquel Water District, creates a buffer zone where saltwater and freshwater meet. When wells draw more water out of the ground than can be replenished by rain, salty ocean water mixes with the groundwater and wells become unusable for drinking water or crop irrigation. O TRUE O FALSE