Page 1 of 1
The graph below shows freezing behavior in response to 2 foot shocks in male rats. There is a significant difference bet
Posted: Sat Jul 02, 2022 9:55 pm
by answerhappygod
- The Graph Below Shows Freezing Behavior In Response To 2 Foot Shocks In Male Rats There Is A Significant Difference Bet 1 (99.61 KiB) Viewed 17 times
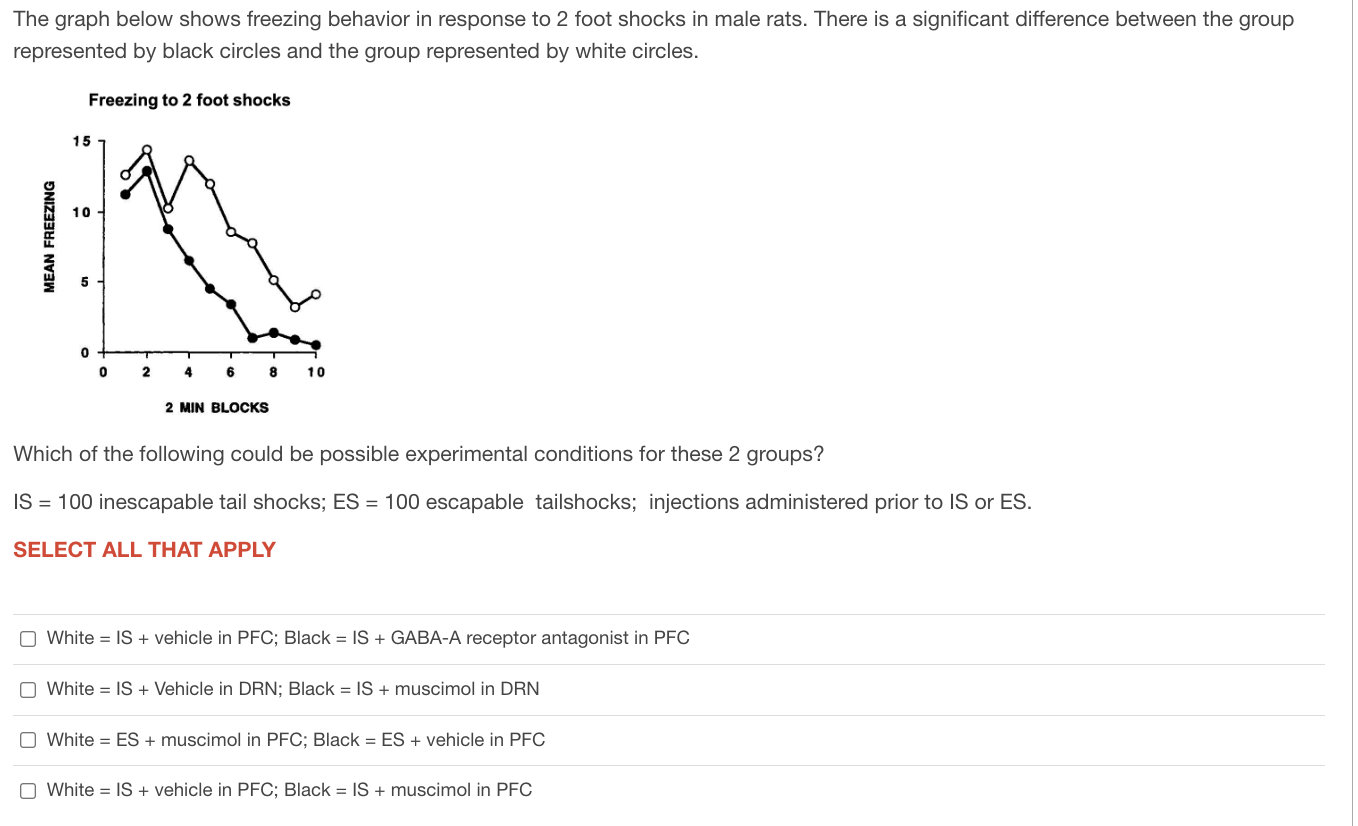
The graph below shows freezing behavior in response to 2 foot shocks in male rats. There is a significant difference between the group represented by black circles and the group represented by white circles. Freezing to 2 foot shocks MEAN FREEZING 15 10 5 0 2 4 6 2 MIN BLOCKS 10 Which of the following could be possible experimental conditions for these 2 groups? IS = 100 inescapable tail shocks; ES = 100 escapable tailshocks; injections administered prior to IS or ES. SELECT ALL THAT APPLY O White = IS + vehicle in PFC; Black = IS + GABA-A receptor antagonist in PFC O White = IS+ Vehicle in DRN; Black = IS + muscimol in DRN O White = ES + muscimol in PFC; Black = ES + vehicle in PFC O White = IS + vehicle in PFC; Black = IS + muscimol in PFC