Page 1 of 1
A simulation model was developed for a drive-up banking facility, and data were collected on the arrival pattern for car
Posted: Tue Sep 07, 2021 7:15 am
by answerhappygod
- A Simulation Model Was Developed For A Drive Up Banking Facility And Data Were Collected On The Arrival Pattern For Car 1 (19.33 KiB) Viewed 114 times
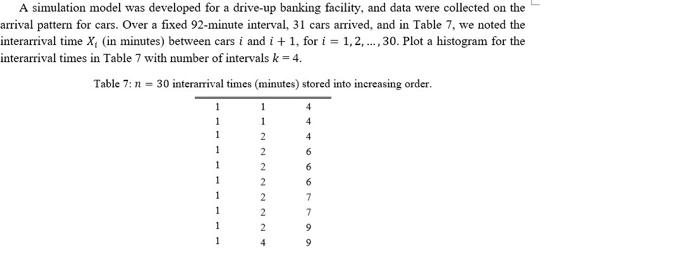
A simulation model was developed for a drive-up banking facility, and data were collected on the arrival pattern for cars. Over a fixed 92-minute interval, 31 cars arrived, and in Table 7, we noted the interarrival time X, (in minutes) between cars i and i + 1, for i = 1,2,..., 30. Plot a histogram for the interarrival times in Table 7 with number of intervals k = 4. Table 7: n = 30 interarrival times (minutes) stored into increasing order. 1 4 4 4 6 1 1 1 1 1 1 2 2 2 2 2 2 2 1 1 1 6 6 7 7 9 1 4