- Question 1 Table 1 Shows Data On Inspection Result Of Products Analyse The Data Using Manual Calculation And Verify The 1 (87.02 KiB) Viewed 42 times
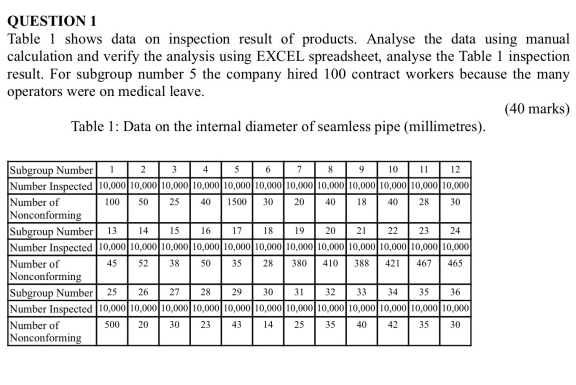
QUESTION 1 Table 1 shows data on inspection result of products. Analyse the data using manual calculation and verify the analysis using EXCEL spreadsheet, analyse the Table 1 inspection result. For subgroup number 5 the
company hired 100 contract workers because the many operators were on medical leave. (40 marks) Table 1: Data on the internal diameter of seamless pipe (millimetres). 7 8 9 10 11 12 10,000 10,000 10,000 10,000 10,000 10,000 10,000 1500 30 20 40 18 40 28 30 Subgroup Number 1 2 3 4 5 6 Number Inspected 10,000 10,000 10,000 10,000 10,000 10,000 Number of 100 50 25 40 15 16 17 18 19 20 21 22 23 24 Nonconforming Subgroup Number 13 14 Number Inspected 10,000 10,000 10,000 10,000 10,000 10,000 10,000 10,000 10,000 10,000 10,000 10,000 35 28 380 388 421 467 465 45 52 38 50 410 Number of Nonconforming Subgroup Number 25 26 Number Inspected 10,000 10,000 10,000 10,000 10,000 10,000 10,000 10,000 10,000 10,000 10,000 10,000 Number of 23 43 14 25 35 40 42 35 30 27 28 29 30 31 32 33 34 35 36 500 20 30 Nonconforming