Page 1 of 1
You have collected data for 104 countries to address the difficult questions of the determinants for differences in the
Posted: Fri Jul 01, 2022 7:55 am
by answerhappygod
- You Have Collected Data For 104 Countries To Address The Difficult Questions Of The Determinants For Differences In The 1 (140.69 KiB) Viewed 33 times
You have collected data for 104 countries to address the difficult
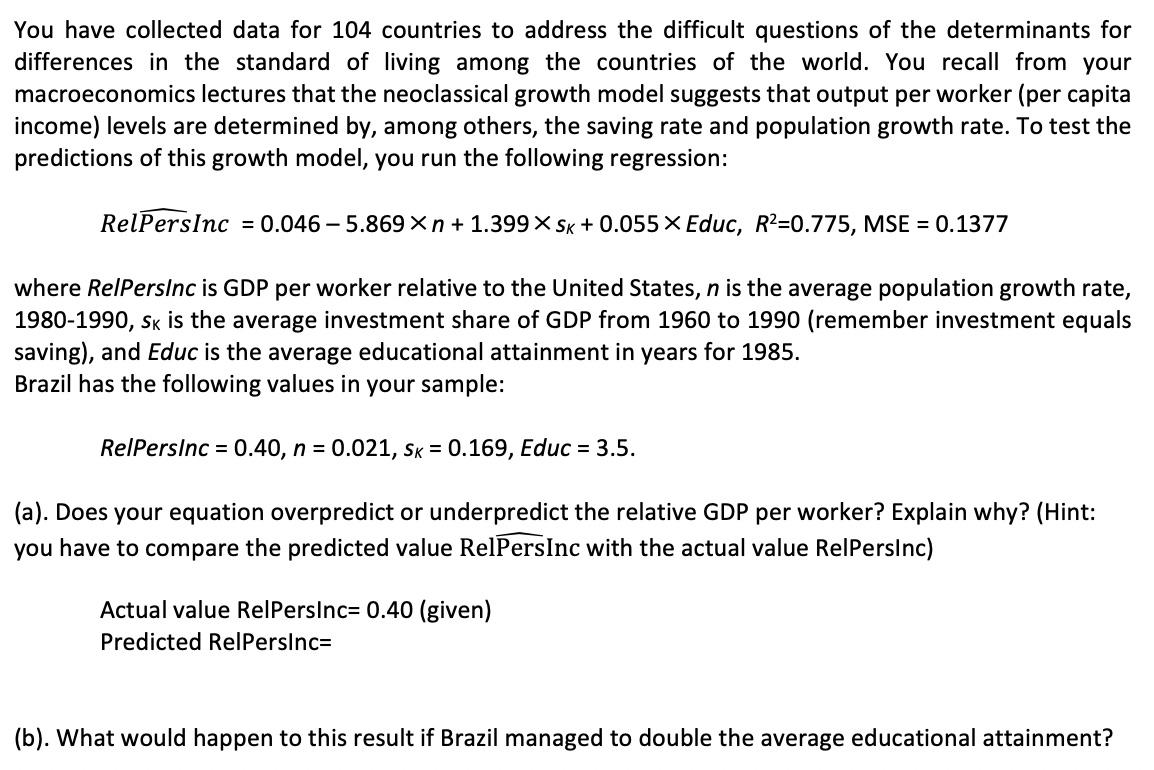
questions of the determinants for differences in the standard of living among the countries of the world. You recall from your macroeconomics lectures that the neoclassical growth model suggests that output per worker (per capita income) levels are determined by, among others, the saving rate and population growth rate. To test the predictions of this growth model, you run the following regression: RelPersInc = 0.046-5.869 X n + 1.399 X SK + 0.055 × Educ, R²=0.775, MSE = 0.1377 where RelPersInc is GDP per worker relative to the United States, n is the average population growth rate, 1980-1990, SK is the average investment share of GDP from 1960 to 1990 (remember investment equals saving), and Educ is the average educational attainment in years for 1985. Brazil has the following values in your sample: RelPersinc = 0.40, n = 0.021, SK = 0.169, Educ = 3.5. (a). Does your equation overpredict or underpredict the relative GDP per worker? Explain why? (Hint: you have to compare the predicted value RelPersInc with the actual value RelPersInc) Actual value RelPersInc= 0.40 (given) Predicted RelPersInc= (b). What would happen to this result if Brazil managed to double the average educational attainment?