Page 1 of 1
1. Do not use MSP for this question! The table below shows the data for a particular project. a) Based on that data, dra
Posted: Wed Mar 30, 2022 3:45 pm
by answerhappygod
- 1 Do Not Use Msp For This Question The Table Below Shows The Data For A Particular Project A Based On That Data Dra 1 (60.91 KiB) Viewed 49 times
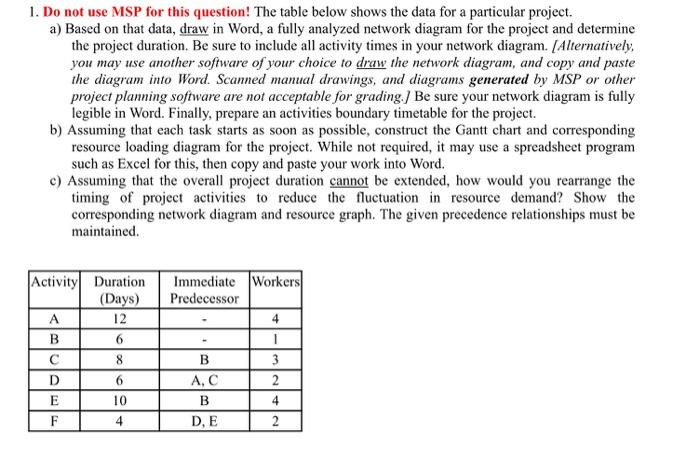
1. Do not use MSP for this question! The table below shows the data for a particular project. a) Based on that data, draw in Word, a fully analyzed network diagram for the project and determine the project duration. Be sure to include all activity times in your network diagram. (Alternatively, you may use another software of your choice to draw the network diagram, and copy and paste the diagram into Word. Scanned manual drawings, and diagrams generated by MSP or other project planning software are not acceptable for grading.) Be sure your network diagram is fully legible in Word. Finally, prepare an activities boundary timetable for the project. b) Assuming that each task starts as soon as possible, construct the Gantt chart and corresponding resource loading diagram for the project. While not required, it may use a spreadsheet program such as Excel for this, then copy and paste your work into Word. C) Assuming that the overall project duration cannot be extended, how would you rearrange the timing of project activities to reduce the fluctuation in resource demand? Show the corresponding network diagram and resource graph. The given precedence relationships must be maintained. Activity Duration (Days) A 12 B 6 с 8 D 6 E 10 F 4 Immediate Workers Predecessor 4 1 B 3 AC 2 B 4 D, E 2