Page 1 of 1
b) Consider the frequency response curve shown in Figure 1(b) and answer the following question: 0 -5 -10 -15 -20 -25 -3
Posted: Fri Jul 01, 2022 6:09 am
by answerhappygod
- B Consider The Frequency Response Curve Shown In Figure 1 B And Answer The Following Question 0 5 10 15 20 25 3 1 (60.71 KiB) Viewed 29 times
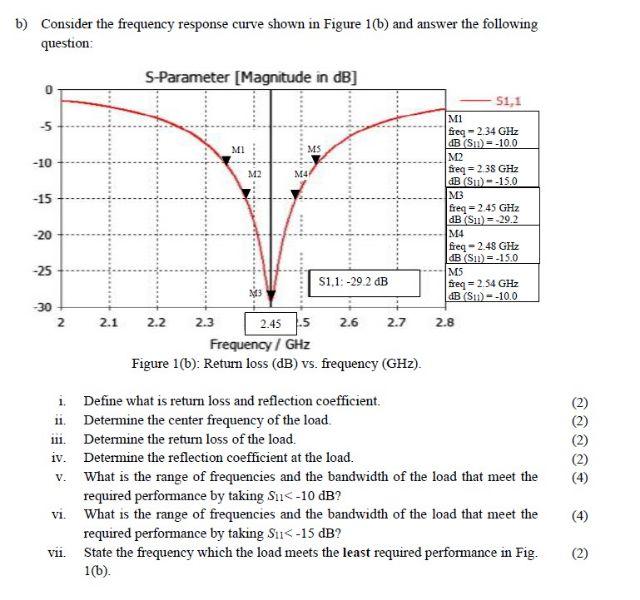
b) Consider the frequency response curve shown in Figure 1(b) and answer the following
question: 0 -5 -10 -15 -20 -25 -30 2 i. ii. 111. iv. V. S-Parameter [Magnitude in dB] vii. 2.1 2.2 2.3 MI M2 M45 M4 ****** $1,1: -29.2 dB 2.45 5 Frequency / GHz Figure 1(b): Return loss (dB) vs. frequency (GHz). 2.6 2.7 $1,1 M1 freq-2.34 GHz dB (S11) = -10.0 M2 Define what is return loss and reflection coefficient. Determine the center frequency of the load. Determine the return loss of the load. Determine the reflection coefficient at the load. What is the range of frequencies and the bandwidth of the load that meet the required performance by taking Su<-10 dB? vi. What is the range of frequencies and the bandwidth of the load that meet the required performance by taking Si<-15 dB? State the frequency which the load meets the least required performance in Fig. 1(b). freq=2.38 GHz dB (S11)--15.0 M3 freq=2.45 GHz dB ($11)=-29.2 M4 freq-2.48 GHz dB ($11)=-15.0 M5 freq=2.54 GHz dB (S11)--10.0 2.8 (4) (2)