Page 1 of 1
4. You are given the table below containing annual sales figures for three different industries in the most recent calen
Posted: Mon Mar 21, 2022 4:31 pm
by answerhappygod
- 4 You Are Given The Table Below Containing Annual Sales Figures For Three Different Industries In The Most Recent Calen 1 (39.25 KiB) Viewed 40 times
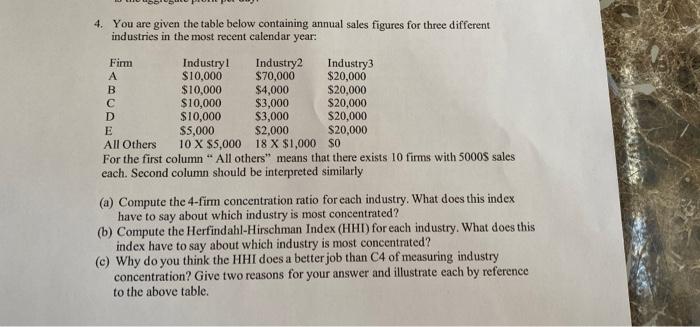
4. You are given the table below containing annual sales figures for three different industries in the most recent calendar year: Firm Industry! Industry2 Industry3 А $10,000 $70,000 $20,000 B $10,000 $4,000 $20,000 с $10,000 $3,000 $20,000 D $10,000 $3,000 $20,000 E $5,000 $2,000 $20,000 All Others 10 X $5,000 18 X $1,000 $0 For the first column "All others" means that there exists 10 firms with 5000$ sales each. Second column should be interpreted similarly (a) Compute the 4-firm concentration ratio for each industry. What does this index have to say about which industry is most concentrated? (b) Compute the Herfindahl-Hirschman Index (HHT) for each industry. What does this index have to say about which industry is most concentrated? (c) Why do think the HHI does a better job than C4 of measuring industry concentration? Give two reasons for your answer and illustrate each by reference to the above table. you