Page 1 of 1
Pareto Chart is a useful quality control (QC) tool to separate the important from the trivial (unimportant). The Pareto
Posted: Fri Mar 04, 2022 10:17 am
by answerhappygod
- Pareto Chart Is A Useful Quality Control Qc Tool To Separate The Important From The Trivial Unimportant The Pareto 1 (52.19 KiB) Viewed 46 times
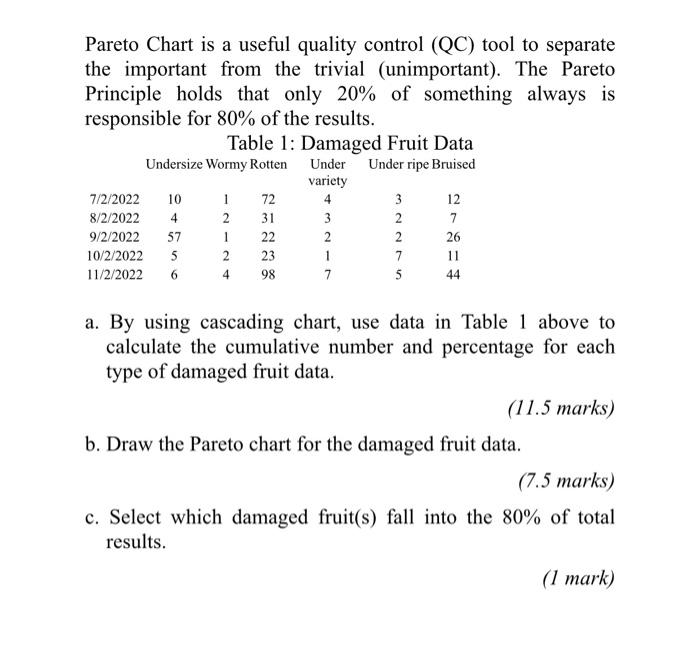
Pareto Chart is a useful quality control (QC) tool to separate the important from the trivial (unimportant). The Pareto Principle holds that only 20% of something always is responsible for 80% of the results. Table 1: Damaged Fruit Data Undersize Wormy Rotten Under Under ripe Bruised variety 7/2/2022 10 1 72 4 3 12 8/2/2022 4 31 3 2 9/2/2022 57 22 2 2 26 10/2/2022 5 2 23 1 7 11 11/2/2022 6 4 98 7 5 44 2 7 1 ANN a. By using cascading chart, use data in Table 1 above to calculate the cumulative number and percentage for each type of damaged fruit data. (11.5 marks) b. Draw the Pareto chart for the damaged fruit data. (7.5 marks) c. Select which damaged fruit(s) fall into the 80% of total results. (1 mark)