Page 1 of 1
Please help me using Matlab
Please, if you are not sure of the solution, do not solve it
Posted: Fri Mar 04, 2022 10:07 am
by answerhappygod
- Please Help Me Using Matlab Please If You Are Not Sure Of The Solution Do Not Solve It 1 (34.21 KiB) Viewed 55 times
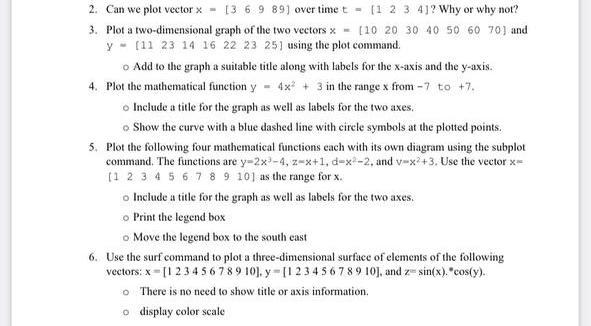
a 2. Can we plot vector x = 13 6 9 89) over time t - 11 2 3 4]? Why or why not? 3. Plot a two-dimensional graph of the two vectors X - [10 20 30 40 50 60 70) and y - [11 23 14 16 22 23 25) using the plot command o Add to the graph a suitable title along with labels for the x-axis and the y-axis. 4. Plot the mathematical function y - 4x + 3 in the range x from -7 to +7. Include a title for the graph as well as labels for the two axes, Show the curve with a blue dashed line with circle symbols at the plotted points. 5. Plot the following four mathematical functions each with its own diagram using the subplot command. The functions are y=2x-4, z=x+1, d-x-2, and v=x2+3. Use the vector x [1 2 3 4 5 6 7 8 9 101 as the range for x. o Include a title for the graph as well as labels for the two axes. Print the legend box Move the legend box to the south east 6. Use the surf command to plot a three-dimensional surface of elements of the following vectors: * = [1 2 3 4 5 6 7 8 9 10), y = [1 2 3 4 5 6 7 8 9 10), and z= sin(x).*cos(y). o There is no need to show title or axis information o display color scale