- Section 3 28 Marks Show Your Work 28 Marks Using The Following Information Calculate The Ratios Below For Each 1 (39.81 KiB) Viewed 45 times
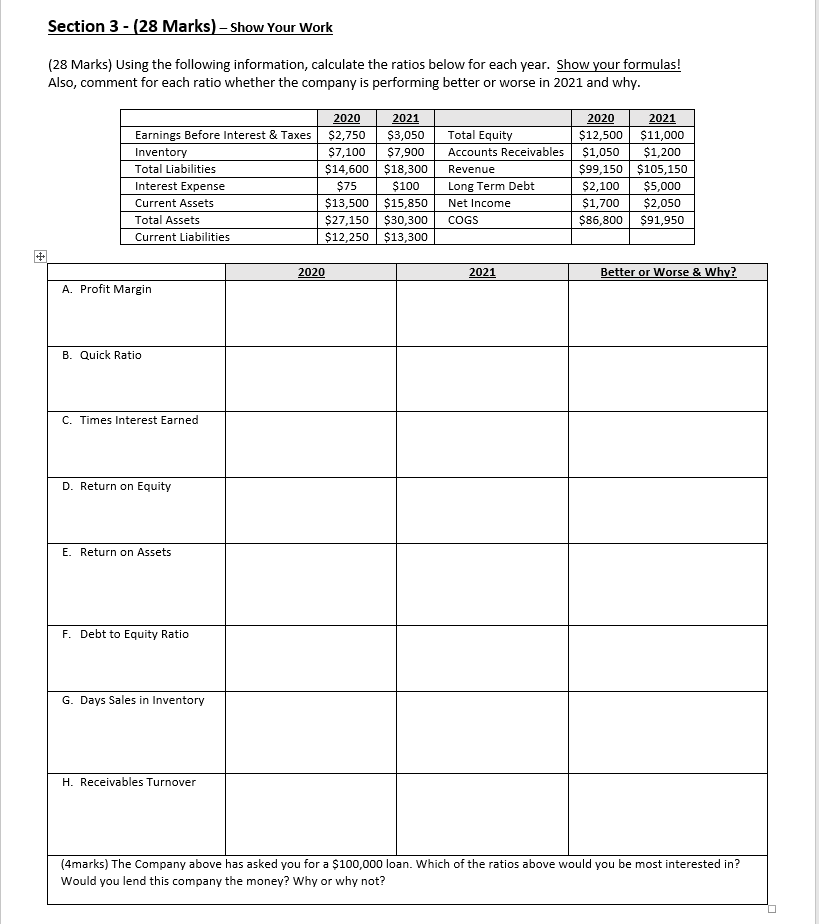
Section 3 - (28 Marks) - Show Your Work (28 Marks) Using the following information, calculate the ratios below for each year. Show your formulas! Also, comment for each ratio whether the company is performing better or worse in 2021 and why. Earnings Before Interest & Taxes Inventory Total Liabilities Interest Expense Current Assets Total Assets Current Liabilities 2020 2021 $2,750 $3,050 $7,100 $7,900 $14,600 $18,300 $75 $100 $13,500 $15,850 $27,150 $30,300 $12,250 $13,300 Total Equity Accounts Receivables Revenue Long Term Debt Net Income COGS 2020 $12,500 $1,050 $99,150 $2,100 $1,700 $86,800 2021 $11,000 $1,200 $105,150 $5,000 $2,050 $91,950 + 2020 2021 Better or Worse & Why? A. Profit Margin B. Quick Ratio C. Times Interest Earned D. Return on Equity E. Return on Assets F. Debt to Equity Ratio G. Days Sales in Inventory H. Receivables Turnover (4marks) The Company above has asked you for a $100,000 loan. Which of the ratios above would you be most interested in? Would you lend this company the money? Why or why not?