Page 1 of 1
Q2. The observations given in the table below were recorded for the traffic flow in the HOV lane at a section of a major
Posted: Sat Feb 26, 2022 11:50 am
by answerhappygod
- Q2 The Observations Given In The Table Below Were Recorded For The Traffic Flow In The Hov Lane At A Section Of A Major 1 (89.14 KiB) Viewed 108 times
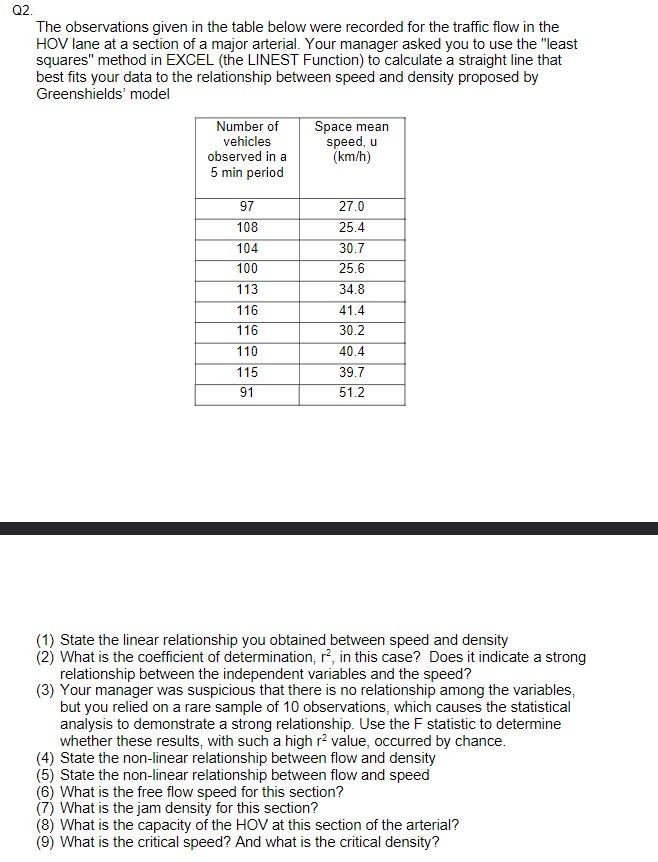
Q2. The observations given in the table below were recorded for the traffic flow in the HOV lane at a section of a major arterial. Your manager asked you to use the "least squares" method in EXCEL (the LINEST Function) to calculate a straight line that best fits your data to the relationship between speed and density proposed by Greenshields' model Number of vehicles observed in a 5 min period Space mean speed, u (km/h) 97 108 104 100 113 116 116 110 115 91 27.0 25.4 30.7 25.6 34.8 41.4 30.2 40.4 39.7 51.2 (1) State the linear relationship you obtained between speed and density (2) What is the coefficient of determination, 12, in this case? Does it indicate a strong relationship between the independent variables and the speed? (3) Your manager was suspicious that there is no relationship among the variables, but you relied on a rare sample of 10 observations, which causes the statistical analysis to demonstrate a strong relationship. Use the F statistic to determine whether these results, with such a high r value, occurred by chance. (4) State the non-linear relationship between flow and density (5) State the non-linear relationship between flow and speed (6) What is the free flow speed for this section? (7) What is the jam density for this section? (8) What is the capacity of the HOV at this section of the arterial? (9) What is the critical speed? And what is the critical density?