Page 1 of 1
Q1. The following list shows the maximum daily temperature, in °C, throughout the months of April, May and June 2020 in
Posted: Sat Feb 26, 2022 11:27 am
by answerhappygod
- Q1 The Following List Shows The Maximum Daily Temperature In C Throughout The Months Of April May And June 2020 In 1 (28.71 KiB) Viewed 69 times
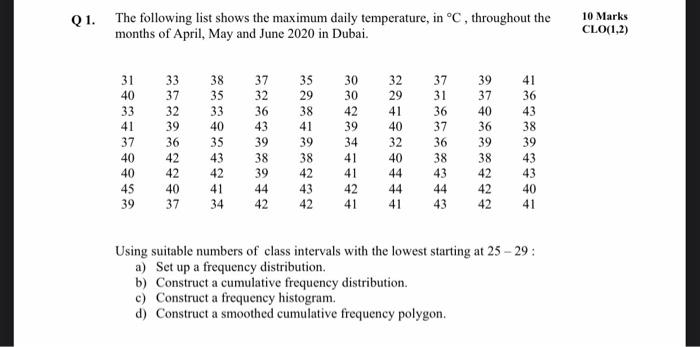
Q1. The following list shows the maximum daily temperature, in °C, throughout the months of April, May and June 2020 in Dubai. 10 Marks CLO(1,2) 31 40 33 41 37 40 40 45 39 33 37 32 39 36 42 42 40 37 38 35 33 40 35 43 42 41 34 37 32 36 43 39 38 39 44 42 35 29 38 41 39 38 42 43 42 30 30 42 39 34 41 41 42 41 32 29 41 40 32 40 44 44 41 37 31 36 37 36 38 43 44 43 39 37 40 36 39 38 42 42 42 41 36 43 38 39 43 43 40 41 Using suitable numbers of class intervals with the lowest starting at 25 - 29: a) Set up a frequency distribution b) Construct a cumulative frequency distribution. c) Construct a frequency histogram. d) Construct a smoothed cumulative frequency polygon.