Page 1 of 1
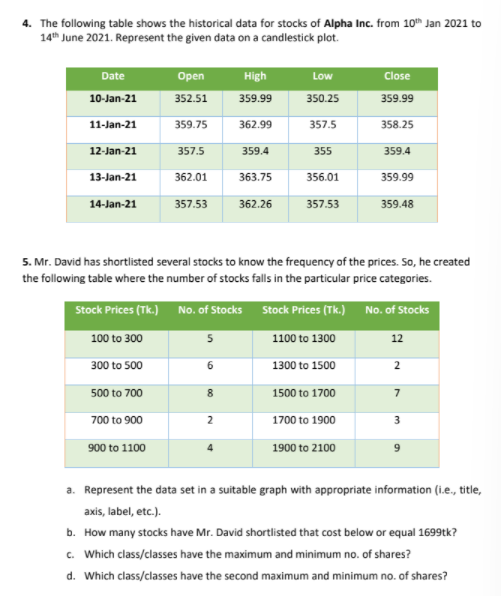
4. The following table shows the historical data for stocks of Alpha Inc. from 10th Jan 2021 to 14th June 2021. Represen
Posted: Sat Feb 26, 2022 11:17 am
by answerhappygod
- 4 The Following Table Shows The Historical Data For Stocks Of Alpha Inc From 10th Jan 2021 To 14th June 2021 Represen 1 (90.43 KiB) Viewed 57 times
4. The following table shows the historical data for stocks of Alpha Inc. from 10th Jan 2021 to 14th June 2021. Represent the given data on a candlestick plot. High Date 10-Jan-21 Open 352.51 359.75 359.99 Low 350.25 357.5 Close 359.99 358.25 362.99 357.5 359.4 355 359.4 11-Jan-21 12-Jan-21 13-Jan-21 14-Jan-21 363.75 356.01 359.99 362.01 357.53 362.26 357.53 359.48 5. Mr. David has shortlisted several stocks to know the frequency of the prices. So, he created the following table where the number of stocks falls in the particular price categories. Stock Prices (Tk.) No. of Stocks Stock Prices (Tk.) No. of Stocks 100 to 300 5 1100 to 1300 12 300 to 500 1300 to 1500 500 to 700 1500 to 1700 700 to 900 1700 to 1900 900 to 1100 1900 to 2100 6 2 8 7 2 3 a. Represent the data set in a suitable graph with appropriate information (i.e., title, axis, label, etc.). b. How many stocks have Mr. David shortlisted that cost below or equal 1699tk? C. Which class/classes have the maximum and minimum no. of shares? d. Which class/classes have the second maximum and minimum no. of shares?