- Now Let S Use T Mobile Only As A Matching Firm And Both Forecasted R D Growth And Forecasted Revenue Growth Equally As 1 (54.44 KiB) Viewed 53 times
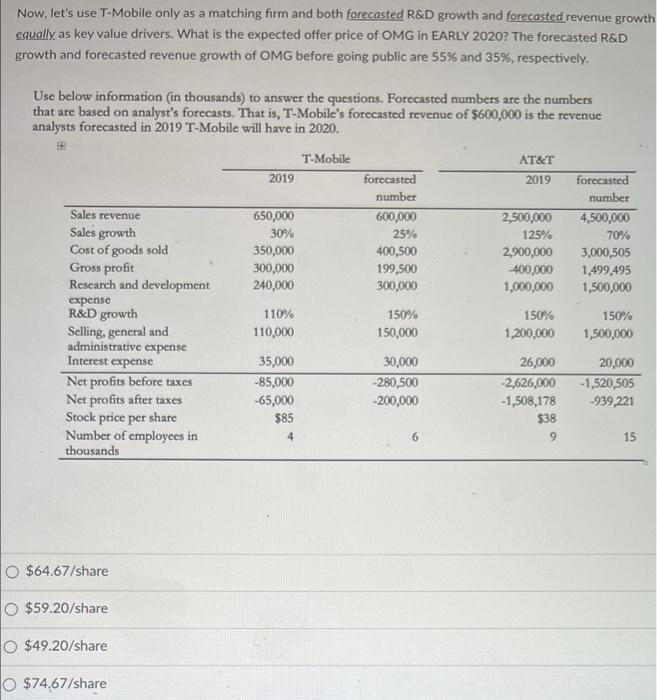
Now, let's use T-Mobile only as a matching firm and both forecasted R&D growth and forecasted revenue growth equally as key value drivers. What is the expected offer price of OMG in EARLY 2020? The forecasted R&D growth and forecasted revenue growth of OMG before going public are 55% and 35%, respectively. Use below information in thousands) to answer the questions. Forecasted numbers are the numbers that are based on analyst's forecasts. That is, T-Mobile's forecasted revenue of $600,000 is the revenue analysts forecasted in 2019 T-Mobile will have in 2020. T-Mobile AT&T 2019 2019 650,000 30% 350,000 300,000 240,000 forecasted number 600,000 25% 400,500 199,500 300,000 2,500,000 125% 2,900,000 400,000 1,000,000 forecasted number 4,500,000 70% 3,000,505 1,499,495 1,500,000 Sales revenue Sales growth Cost of goods sold Gross profit Research and development expense R&D growth Selling, general and administrative expense Interest expense Net profits before taxes Net profits after taxes Stock price per share Number of employees in thousands 110% 110,000 150% 150,000 150% 1,500,000 35,000 -85,000 -65,000 $85 4 30,000 -280,500 -200,000 150% 1,200,000 26,000 -2,626,000 -1,508,178 $38 9 20,000 -1,520,505 -939,221 6 15 O $64.67/share O $59.20/share O $49.20/share O $74.67/share