Page 1 of 1
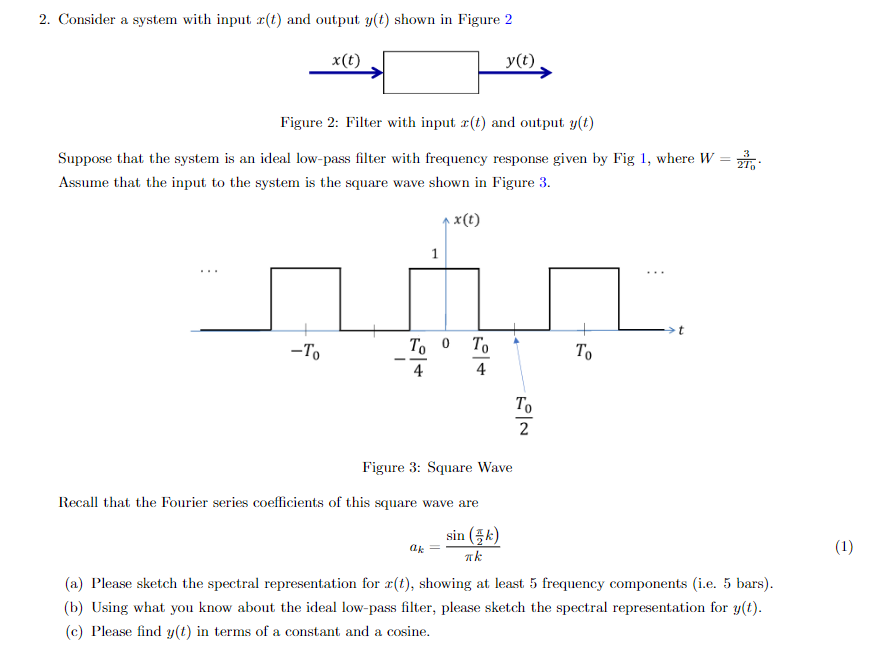
2. Consider a system with input r(t) and output y(t) shown in Figure 2 x(t) y(t) Figure 2: Filter with input r(t) and ou
Posted: Sat Feb 19, 2022 3:23 pm
by answerhappygod
- 2 Consider A System With Input R T And Output Y T Shown In Figure 2 X T Y T Figure 2 Filter With Input R T And Ou 1 (57.85 KiB) Viewed 70 times
2. Consider a system with input r(t) and output y(t) shown in Figure 2 x(t) y(t) Figure 2: Filter with input r(t) and output y(t) Suppose that the system is an ideal low-pass filter with frequency response given by Fig 1, where W = 2*, Assume that the input to the system is the square wave shown in Figure 3. X(t) -T. Το ο То 4 + To 4 T. 2 Figure 3: Square Wave Recall that the Fourier series coefficients of this square wave are sin (k) ak ak (1) (a) Please sketch the spectral representation for r(t), showing at least 5 frequency components (i.e. 5 bars). (b) Using what you know about the ideal low-pass filter, please sketch the spectral representation for y(t). (c) Please find y(t) in terms of a constant and a cosine.