Page 1 of 1
3. For the figure shown below, plot the variation of vertical stress increase, Apz, in the x-z plane for the following c
Posted: Sat Feb 19, 2022 3:14 pm
by answerhappygod
- 3 For The Figure Shown Below Plot The Variation Of Vertical Stress Increase Apz In The X Z Plane For The Following C 1 (106.92 KiB) Viewed 66 times
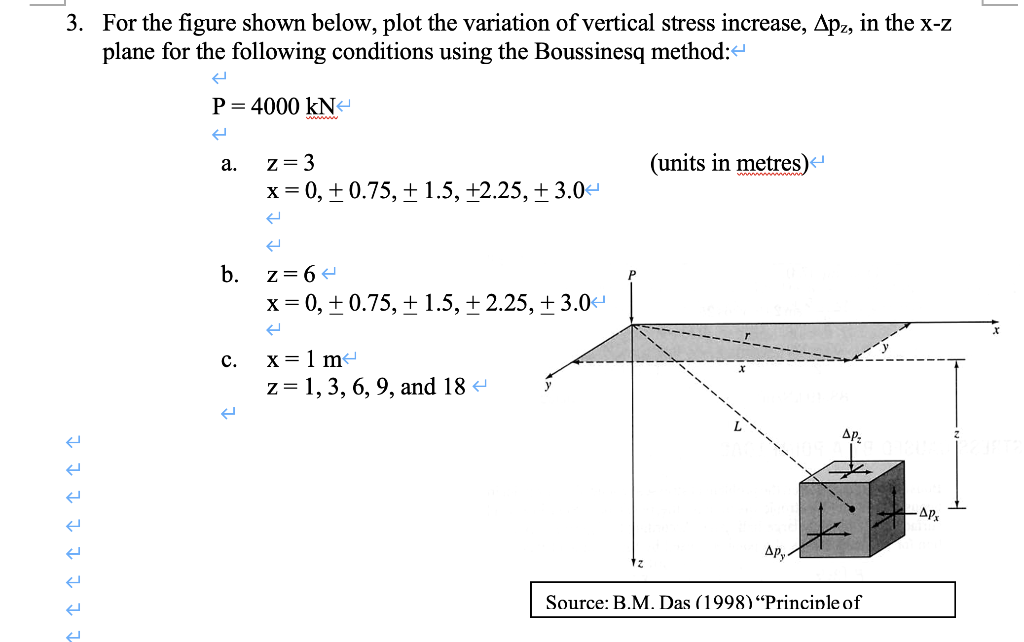
3. For the figure shown below, plot the variation of vertical stress increase, Apz, in the x-z plane for the following conditions using the Boussinesq method: P= 4000 KN a. (units in metres) z= 3 x=0, +0.75, +1.5, +2.25, + 3.04 b. z= 6 x=0, +0.75, + 1.5, +2.25, +3.04 c. x=1 m z=1, 3, 6, 9, and 18 Į Î Î Î Î Î Î Î -Др, Apy Source: B.M. Das (1998)“Principle of