- Measures Of Dispersion Inter Quartile Range United States 2018 Income Range Family Type Total Number Of 15 000 25 0 1 (94.46 KiB) Viewed 84 times
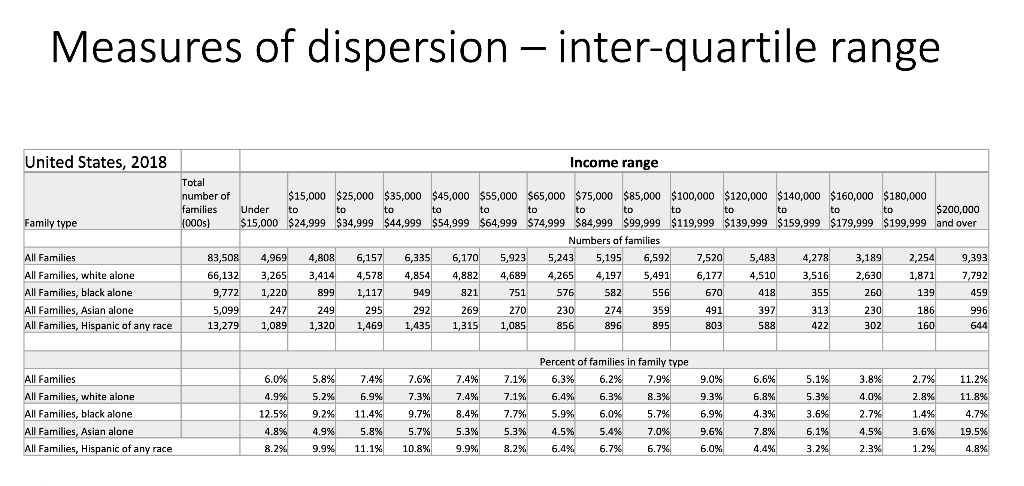
Measures of dispersion - inter-quartile range United States, 2018 Income range Family type Total number of $15,000 $25,000 $35,000 $45,000 $55,000 $65,000 $75,000 $85,000 $100,000 $120,000 $140,000 $160,000 $180,000 families Under to to to to to to to to to to to to to (000s) $15,000 $24,999 $34,999 $44,999 $54,999 $64,999 $74,999 $84,999 $99,999 $119,999 $139,999 $159,999 $179,999 $199,999 and over $200,000 Numbers of families 83,508 4,969 4,808 6,157 6,335 5,923 5,195 6,592 7,520 5,483 4,278 3,189 2,254 9,393 66,132 3,265 3,414 4,578 4,854 4,882 4,689 4,265 4,197 5,491 6,177 4,510 3,516 2,630 1,871 9,772 7,792 1,220 899 1,117 949 821 751 576 582 556 670 418 355 260 139 459 5,099 247 249 295 292 269 270 230 274 359 491 397 313 230 186 13,279 996 1,089 1.320 1,469 1,435 1,315 1,085 856 896 895 803 588 422 302 160 644 6,170 All Families All Families, white alone All Families, black alone All Families, Asian alone , All Families, Hispanic of any race 5,243 5.8% 7.6% 3.8% 11.2% 7.3% All Families All Families, white alone All Families, black alone , All Families, Asian alone All Families, Hispanic of any race 6.0% 4.9% 12.5% 4.8% 8.2% 7.4% 6.9% 11,4% 5.2% 9.2% 7.4% 7.4% 8.4% 11.8% Percent of families in family type 6.3% 6.2% 7.9% 6.4% 6.3% 8.3% 5.9%. 6,0% 5.7% 4.5% 5.4% 7.0% 6.4% 6.7% 7.1% 7.1% 7.7% 5.3% 8.2%. 9.0% 9.3% 6.9% 6.6% 6.8% 4.3% 5.1% 5.3% 3.6% 6.1% 3.2% 2.7% 2.8% 1,4% 4.0% 2.7% 4.7% 9.7% 5.7% 10.8% 5.3% 4.9% 9.9% 4.5% 5.8% 11.1% 9.6% 6.0% 7.8% 4.4% 3.6% 1.2% 19.5% 4.8% 9.9% 6.7% 2.3%