Page 1 of 1
The pie chart to the right shows how adults rate their financial shape. Suppose 20 people are chosen at random from a gr
Posted: Thu Feb 17, 2022 11:01 am
by answerhappygod
- The Pie Chart To The Right Shows How Adults Rate Their Financial Shape Suppose 20 People Are Chosen At Random From A Gr 1 (21.01 KiB) Viewed 99 times
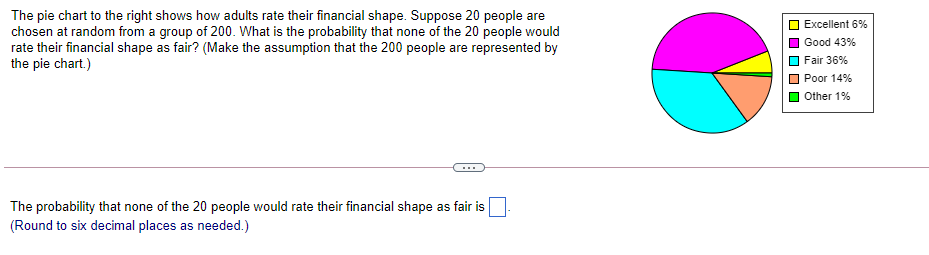
The pie chart to the right shows how adults rate their financial shape. Suppose 20 people are chosen at random from a group of 200. What is the probability that none of the 20 people would rate their financial shape as fair? (Make the assumption that the 200 people are represented by the pie chart.) Excellent 6% Good 43% Fair 36% Poor 14% Other 1% The probability that none of the 20 people would rate their financial shape as fair is (Round to six decimal places as needed.)