- Metro Area 2012 2013 2013 87 8 2012 193 5 115 1 Metro Area Philadelphia Pa Phoenix Az Portland Or 197 7 169 0 226 5 A 1 (35.74 KiB) Viewed 72 times
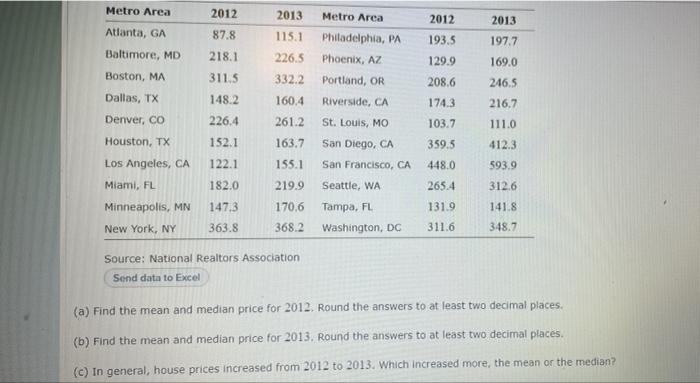
Metro Area 2012 2013 2013 87.8 2012 193.5 115.1 Metro Area Philadelphia, PA Phoenix, AZ Portland, OR 197.7 169.0 226.5 Atlanta, GA Baltimore, MD Boston, MA Dallas, TX Denver, CO 129.9 218.1 311.5 148.2 332.2 246.5 208.6 174.3 160.4 Riverside, CA 226.4 216.7 111.0 261.2 Houston, TX 152.1 St. Louis, MO San Diego, CA San Francisco, CA 163.7 155.1 103.7 359.5 448.0 412.3 122.1 593.9 182.0 219.9 Seattle, WA 265.4 312.6 Los Angeles, CA Miami, FL Minneapolis, MN New York, NY 170,6 131.9 147,3 363.8 Tampa, FL Washington, DC 141.8 348.7 368.2 311.6 Source: National Realtors Association Send data to Excel (a) Find the mean and median price for 2012. Round the answers to at least two decimal places. (b) Find the mean and median price for 2013. Round the answers to at least two decimal places. (c) In general, house prices increased from 2012 to 2013. Which increased more, the mean or the median?