Page 1 of 1
For a 3 sigma control chart of the process mean, the probability that the point falls outside control limits when the pr
Posted: Thu Feb 17, 2022 10:57 am
by answerhappygod
- For A 3 Sigma Control Chart Of The Process Mean The Probability That The Point Falls Outside Control Limits When The Pr 1 (22.91 KiB) Viewed 53 times
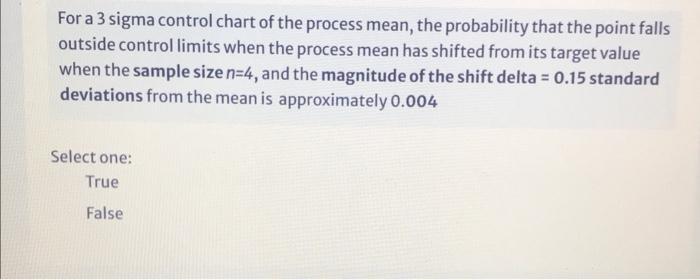
For a 3 sigma control chart of the process mean, the probability that the point falls outside control limits when the process mean has shifted from its target value when the sample size n=4, and the magnitude of the shift delta = 0.15 standard deviations from the mean is approximately 0.004 Select one: True False