Page 1 of 1
Analysis of Variance Source DF Adj ss Adj MS F-Value P-value Regression mb) 35250756 ( ) > 0.000 Error ml ) 7448393 ( )
Posted: Thu Jan 13, 2022 5:49 am
by answerhappygod
- Analysis Of Variance Source Df Adj Ss Adj Ms F Value P Value Regression Mb 35250756 0 000 Error Ml 7448393 1 (40.16 KiB) Viewed 112 times
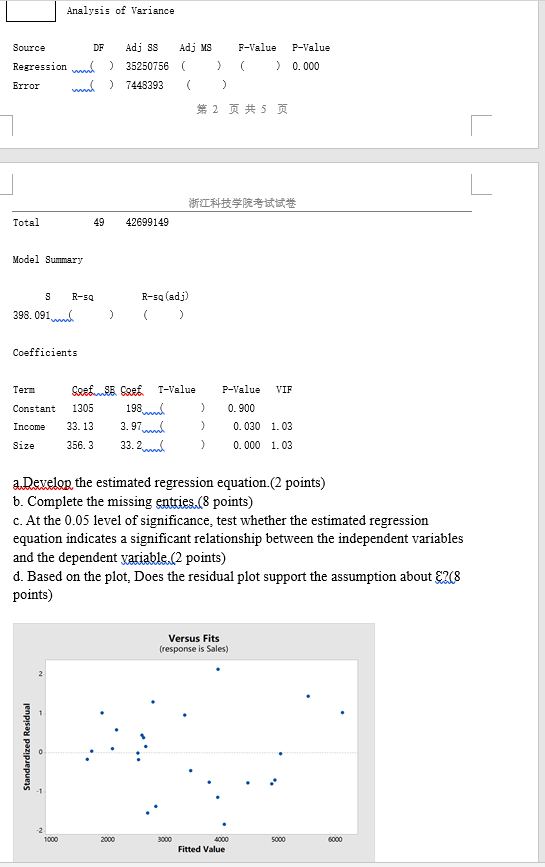
Analysis of Variance Source DF Adj ss Adj MS F-Value P-value Regression mb) 35250756 ( ) > 0.000 Error ml ) 7448393 ( ) 第2 页共5页 浙江科技学院考试试卷 Total 49 42699149 Model Summary R-5 R-sq (adj) S 398.091 ) Coefficients Term P-value VIF Constant Sert SB. Soek I-Value 1305 ) 33.13 356. 3 33.2mm ) 198 3.97 Income 0.900 0.030 1.03 0.000 1.03 Size a Develop the estimated regression equation (2 points) 6. Complete the missing entries.(8 points) c. At the 0.05 level of significance, test whether the estimated regression equation indicates a significant relationship between the independent variables and the dependent variable.(2 points) d. Based on the plot, Does the residual plot support the assumption about E2C8 points) Versus Fits (response is Sales) Standardized Residual -2 1000 2000 3000 5000 6000 4000 Fitted Value