Page 1 of 1
A large, national grocery retailer tracks productivity and costs of its facilities closely. Data below were obtained fro
Posted: Thu Jan 13, 2022 5:46 am
by answerhappygod
- A Large National Grocery Retailer Tracks Productivity And Costs Of Its Facilities Closely Data Below Were Obtained Fro 1 (245.53 KiB) Viewed 107 times
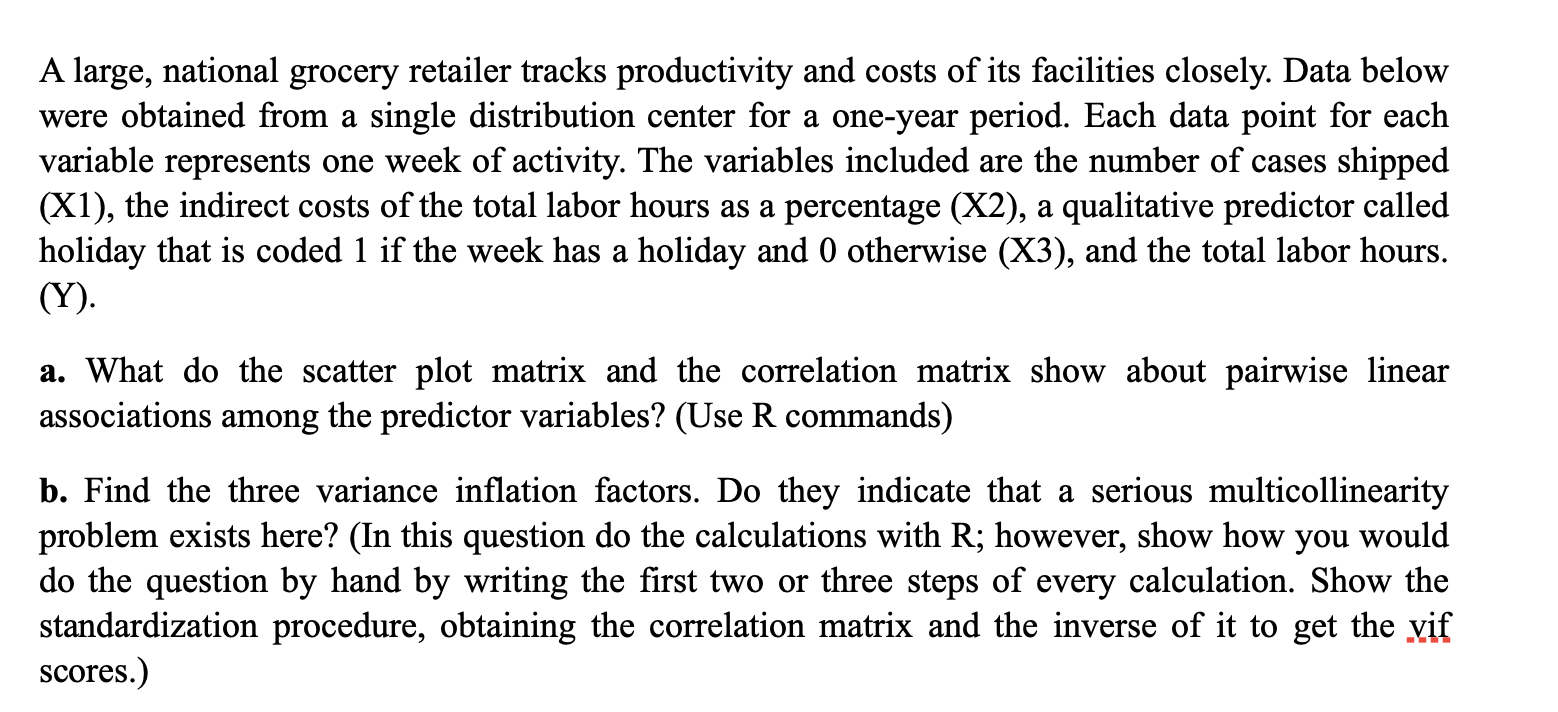
A large, national grocery retailer tracks productivity and costs of its facilities closely. Data below were obtained from a single distribution center for a one-year period. Each data point for each variable represents one week of activity. The variables included are the number of cases shipped (X1), the indirect costs of the total labor hours as a percentage (X2), a qualitative predictor called holiday that is coded 1 if the week has a holiday and 0 otherwise (X3), and the total labor hours. (Y). a. What do the scatter plot matrix and the correlation matrix show about pairwise linear associations among the predictor variables? (Use R commands) b. Find the three variance inflation factors. Do they indicate that a serious multicollinearity problem exists here? (In this question do the calculations with R; however, show how you would do the question by hand by writing the first two or three steps of every calculation. Show the standardization procedure, obtaining the correlation matrix and the inverse of it to get the vif scores.)