Page 1 of 1
1. Granger causality in Vector Error Correction Model is employed when cointegration is detected to avoid problem of mis
Posted: Thu Jan 13, 2022 5:46 am
by answerhappygod
- 1 Granger Causality In Vector Error Correction Model Is Employed When Cointegration Is Detected To Avoid Problem Of Mis 1 (104.55 KiB) Viewed 100 times
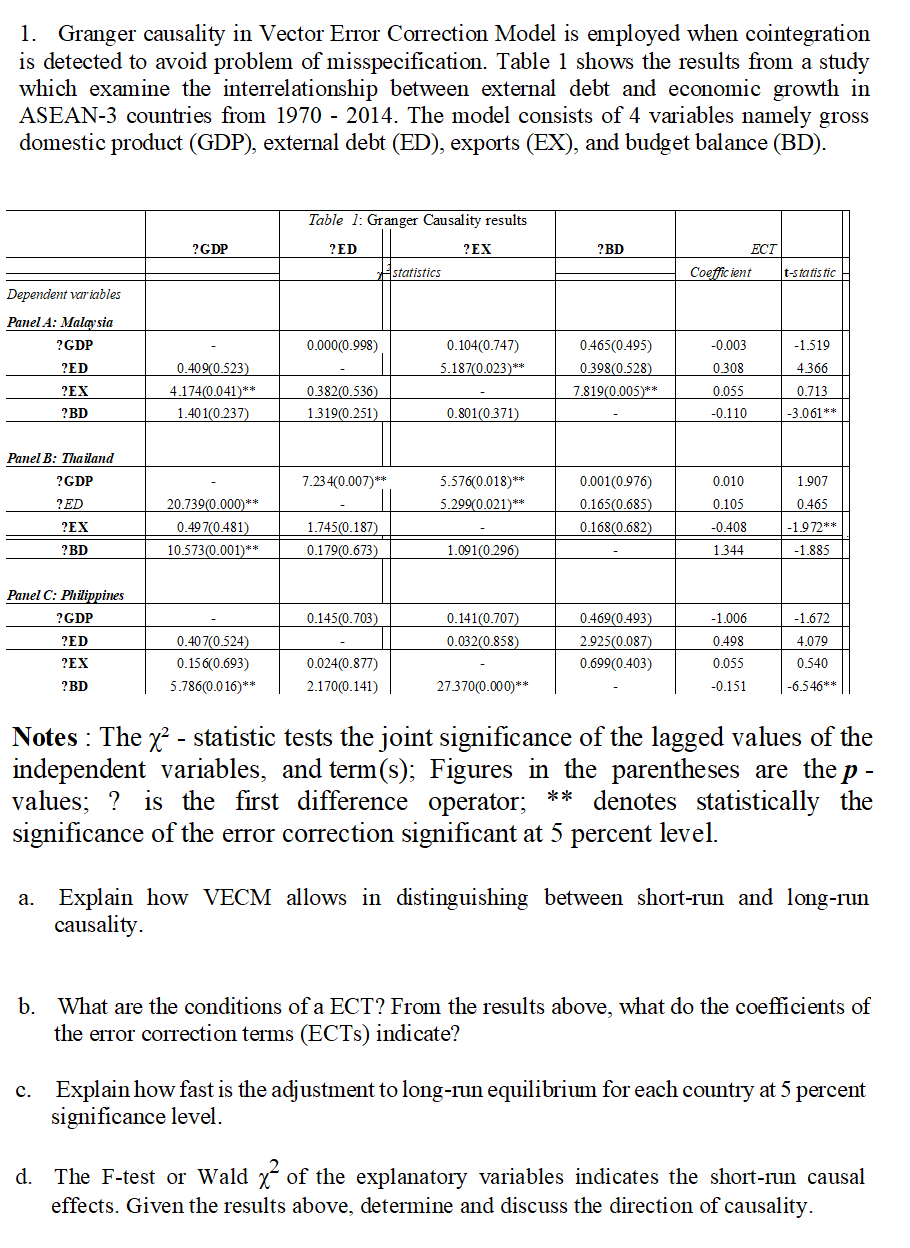
1. Granger causality in Vector Error Correction Model is employed when cointegration is detected to avoid problem of misspecification. Table 1 shows the results from a study which examine the interrelationship between external debt and economic growth in ASEAN-3 countries from 1970 - 2014. The model consists of 4 variables namely gross domestic product (GDP), external debt (ED), exports (EX), and budget balance (BD). Table 1: Granger Causality results ? GDP ?ED ?EX ?BD ECT Coefficient t-statistic statistics Dependent variables Panel A: Malaysia ? GDP 0.000(0.998) -0.003 -1.519 0.104(0.747) 5.1870.023) ** ?ED ?EX ?BD 4366 0.465(0.495) 0.398(0.528) 7.819(0.005** 0.409(0.523) 4.174(0.041) ** 1.401(0.237) 0.382(0.536) 1319(0.251) 0.308 0.055 -0.110 0.713 -3.061** 0.801(0.371) Panel B: Thailand ? GDP ?ED 7.234(0.007) ** 1.907 5.576(0.018)** 5.299(0.021)** 20.739(0.000)** 0.001(0.976) 0.165(0.685) 0.168(0.682) 0.010 0.105 -0.408 1.344 ?EX 0.49 7(0.481) 1.745(0.187) 0.179(0.673) 0.465 -1.972** -1.885 ?BD 10.573(0.001)** 1.091(0.296) 0.145(0.703) -1.006 Panel C: Philippines ? GDP ?ED ?EX -1.672 0.141(0.707) 0.032(0.858) 0.40 7(0.524) 0.156(0.693) 5.786(0.016)** 0.469(0.493) 2.925(0.087) 0.699(0.403) 0.498 0.055 0.024(0.877) 2.170(0.141) 4.079 0.540 -6.546** ?BD 27 37000.000)** -0.151 Notes : The x? - statistic tests the joint significance of the lagged values of the independent variables, and term(s); Figures in the parentheses are the p - values; ? is the first difference operator; ** denotes statistically the significance of the error correction significant at 5 percent level. a. Explain how VECM allows in distinguishing between short-run and long-run causality. b. What are the conditions of a ECT? From the results above, what do the coefficients of the error correction terms (ECTS) indicate? C. Explain how fast is the adjustment to long-run equilibrium for each country at 5 percent significance level. d. The F-test or Wald x2 of the explanatory variables indicates the short-run causal effects. Given the results above, determine and discuss the direction of causality.