Page 1 of 1
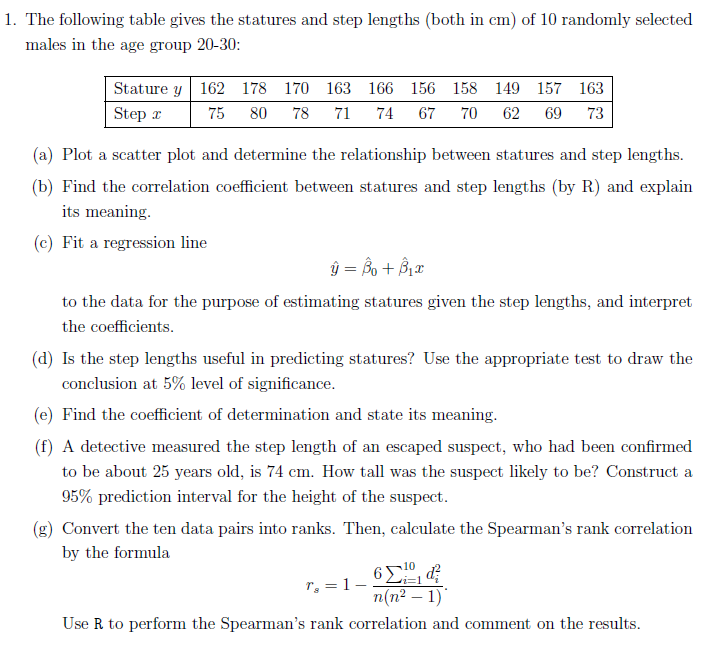
1. The following table gives the statures and step lengths (both in cm) of 10 randomly selected males in the age group 2
Posted: Thu Jan 13, 2022 5:45 am
by answerhappygod
- 1 The Following Table Gives The Statures And Step Lengths Both In Cm Of 10 Randomly Selected Males In The Age Group 2 1 (90.62 KiB) Viewed 87 times
1. The following table gives the statures and step lengths (both in cm) of 10 randomly selected males in the age group 20-30: Stature y 162 178 170 163 166 156 158 149 157 163 Step 2 75 80 78 71 74 67 70 62 69 73 (a) Plot a scatter plot and determine the relationship between statures and step lengths. (b) Find the correlation coefficient between statures and step lengths (by R) and explain its meaning. (c) Fit a regression line = Bo + Box to the data for the purpose of estimating statures given the step lengths, and interpret the coefficients. (d) Is the step lengths useful in predicting statures? Use the appropriate test to draw the conclusion at 5% level of significance. (e) Find the coefficient of determination and state its meaning. (f) A detective measured the step length of an escaped suspect, who had been confirmed to be about 25 years old, is 74 cm. How tall was the suspect likely to be? Construct a 95% prediction interval for the height of the suspect. (g) Convert the ten data pairs into ranks. Then, calculate the Spearman's rank correlation by the formula 10 To=1-68,19, n(n2 - 1) Use R to perform the Spearman's rank correlation and comment on the results.