Page 1 of 1
In Example 1.3 in the textbook, the least squares line of best fit was obtained from statistical software, and was given
Posted: Sun Sep 05, 2021 5:13 pm
by answerhappygod
- In Example 1 3 In The Textbook The Least Squares Line Of Best Fit Was Obtained From Statistical Software And Was Given 1 (86.96 KiB) Viewed 80 times
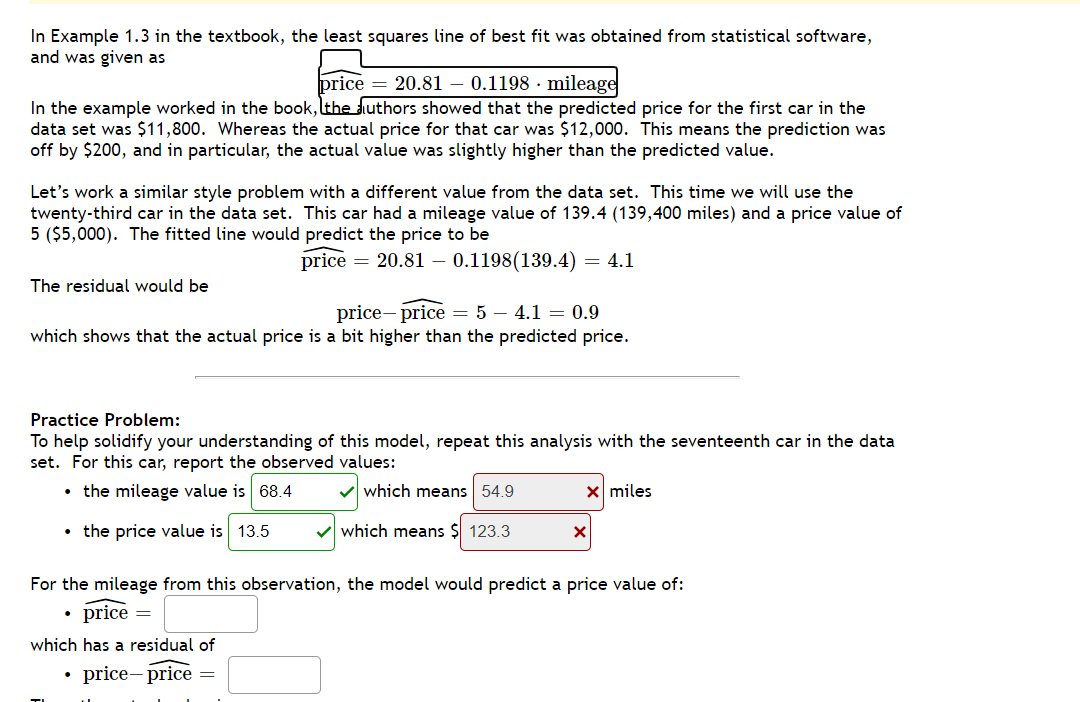
In Example 1.3 in the textbook, the least squares line of best fit was obtained from statistical software, and was given as price = 20.81 – 0.1198 mileage In the example worked in the book, the luthors showed that the predicted price for the first car in the data set was $11,800. Whereas the actual price for that car was $12,000. This means the prediction was off by $200, and in particular, the actual value was slightly higher than the predicted value. Let's work a similar style problem with a different value from the data set. This time we will use the twenty-third car in the data set. This car had a mileage value of 139.4 (139,400 miles) and a price value of 5 ($5,000). The fitted line would predict the price to be price = 20.81 – 0.1198(139.4) = 4.1 The residual would be price-price = 5 – 4.1 = 0.9 which shows that the actual price is a bit higher than the predicted price. Practice Problem: To help solidify your understanding of this model, repeat this analysis with the seventeenth car in the data set. For this car, report the observed values: • the mileage value is 68.4 which means 54.9 x miles • the price value is 13.5 which means $ 123.3 Х For the mileage from this observation, the model would predict a price value of: price = which has a residual of price-price