Page 1 of 1
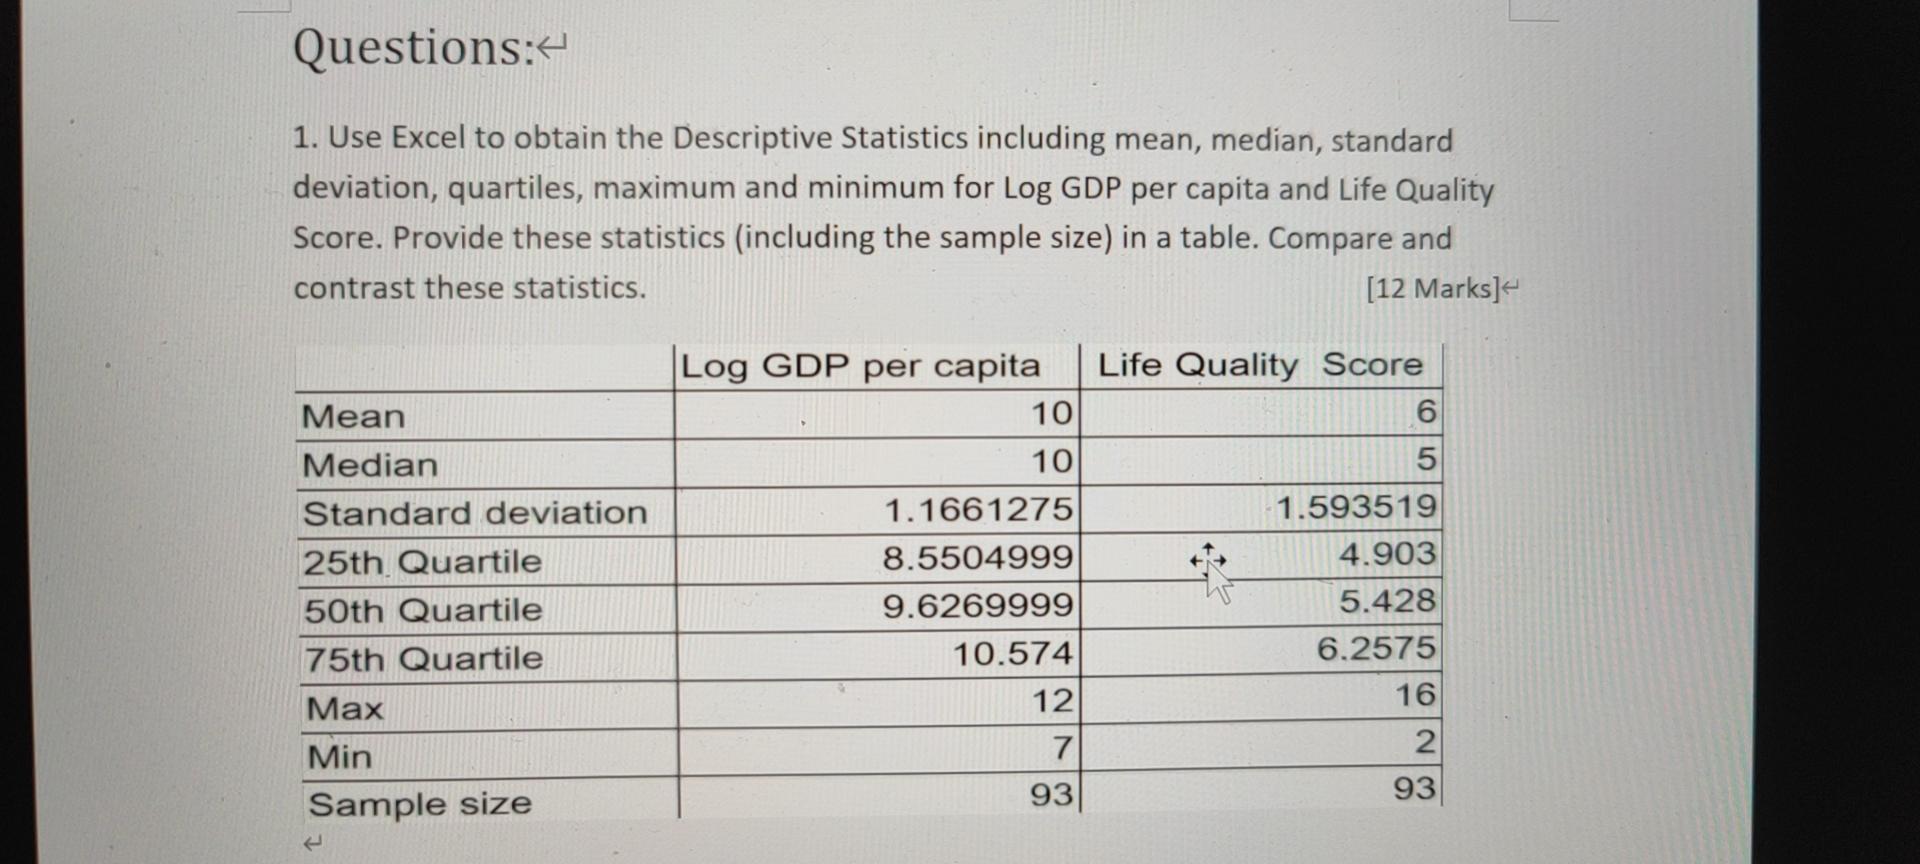
Questions: 1. Use Excel to obtain the Descriptive Statistics including mean, median, standard deviation, quartiles, maxi
Posted: Sun Sep 05, 2021 5:13 pm
by answerhappygod
- Questions 1 Use Excel To Obtain The Descriptive Statistics Including Mean Median Standard Deviation Quartiles Maxi 1 (163.28 KiB) Viewed 96 times
Questions: 1. Use Excel to obtain the Descriptive Statistics including mean, median, standard deviation, quartiles, maximum and minimum for Log GDP per capita and Life Quality Score. Provide these statistics (including the sample size) in a table. Compare and contrast these statistics. [12 Marks] Life Quality Score 6 5 Mean Median Standard deviation 25th Quartile 50th Quartile 75th Quartile Max Min Sample size Log GDP per capita 10 10 1.1661275 8.5504999 9.6269999 10.574 12 7 93 1.593519 4.903 5.428 6.2575 16 2 93 لم