Page 1 of 1
Plot[{ExpectXgivenYis [y], ExpectX}, {y, Ylow, Yhigh}, PlotStyle -> {{Thickness [0.01], LightRed}, {Thickness [0.02], Gr
Posted: Sun Sep 05, 2021 5:12 pm
by answerhappygod
- Plot Expectxgivenyis Y Expectx Y Ylow Yhigh Plotstyle Thickness 0 01 Lightred Thickness 0 02 Gr 1 (66.4 KiB) Viewed 596 times
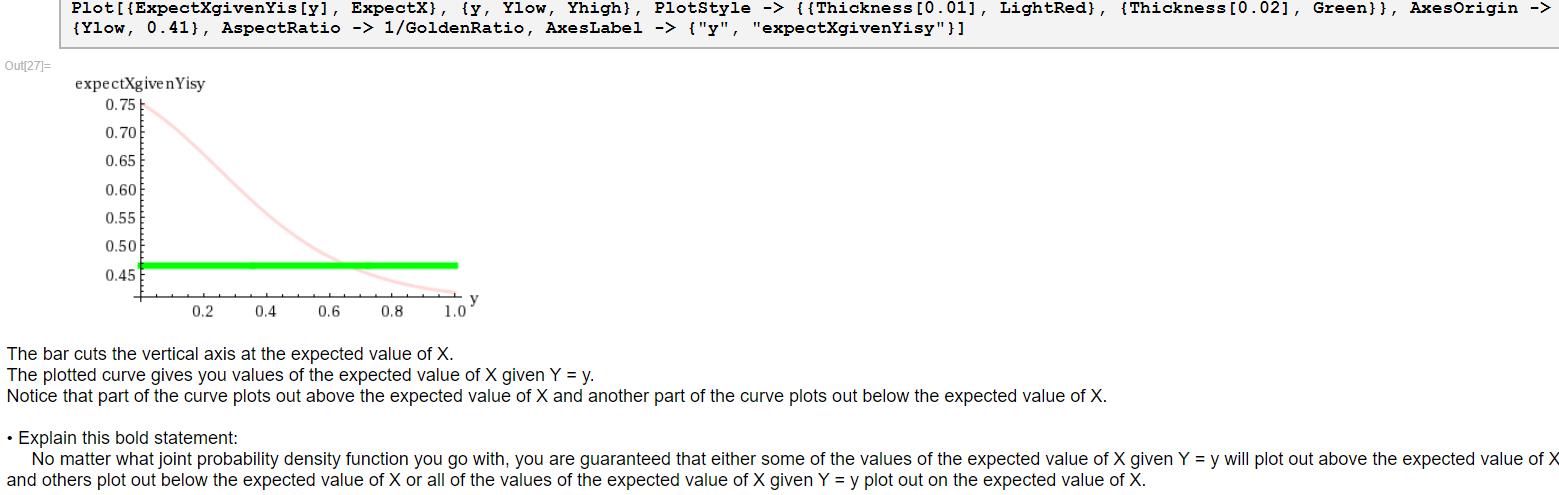
Plot[{ExpectXgivenYis [y], ExpectX}, {y, Ylow, Yhigh}, PlotStyle -> {{Thickness [0.01], LightRed}, {Thickness [0.02], Green}}, Axes Origin -> {Ylow, 0.41}, AspectRatio -> 1/GoldenRatio, AxesLabel -> { "y", "expectXgivenYisy"}] Out[27]= expectXgiven Yisy 0.75 0.70 0.65 0.60 0.55 0.501 0.45 у 0.2 0.4 0.6 0.8 1.0 The bar cuts the vertical axis at the expected value of X. The plotted curve gives you values of the expected value of X given Y = y. Notice that part of the curve plots out above the expected value of X and another part of the curve plots out below the expected value of X. • Explain this bold statement: No matter what joint probability density function you go with, you are guaranteed that either some of the values of the expected value of X given Y = y will plot out above the expected value of X and others plot out below the expected value of X or all of the values of the expected value of X given Y = y plot out on the expected value of X.