Page 1 of 1
In Professor Friedman's economics course the correlation between the students' total scores before the final examination
Posted: Sun Sep 05, 2021 5:12 pm
by answerhappygod
- In Professor Friedman S Economics Course The Correlation Between The Students Total Scores Before The Final Examination 1 (33.83 KiB) Viewed 95 times
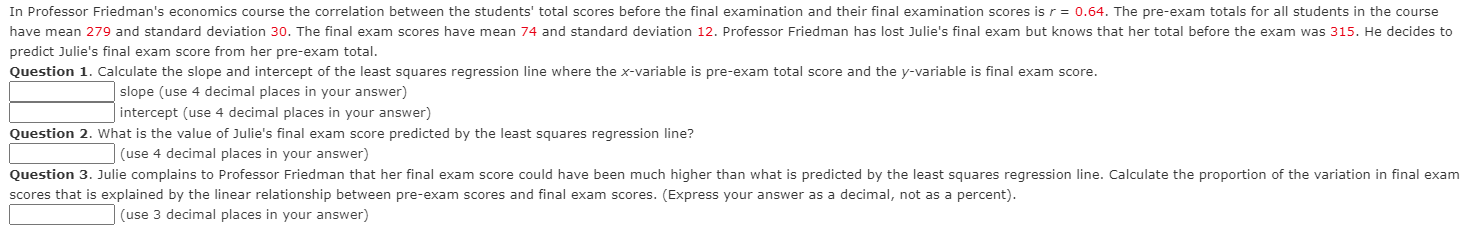
In Professor Friedman's economics course the correlation between the students' total scores before the final examination and their final examination scores is r = 0.64. The pre-exam totals for all students in the course have mean 279 and standard deviation 30. The final exam scores have mean 74 and standard deviation 12. Professor Friedman has lost Julie's final exam but knows that her total before the exam was 315. He decides to predict Julie's final exam score from her pre-exam total.
Question 1. Calculate the slope and intercept of the least squares regression line where the x-variable is pre-exam total score and the y-variable is final exam score. slope (use 4 decimal places in your answer) intercept (use 4 decimal places in your answer)
Question 2. What is the value of Julie's final exam score predicted the least squares regression line? (use 4 decimal places in your answer)
Question 3. Julie complains to Professor Friedman that her final exam score could have been much higher than what is predicted the least squares regression line. Calculate the proportion of the variation in final exam scores that is explained by the linear relationship between pre-exam scores and final exam scores. (Express your answer as a decimal, not as a percent). (use 3 decimal places in your answer)