Page 1 of 1
Facebook vs GPA - Clustering: You will need to use software to answer these questions. Below is the scatterplot, regress
Posted: Wed Dec 15, 2021 10:32 am
by answerhappygod
- Facebook Vs Gpa Clustering You Will Need To Use Software To Answer These Questions Below Is The Scatterplot Regress 1 (101.27 KiB) Viewed 74 times
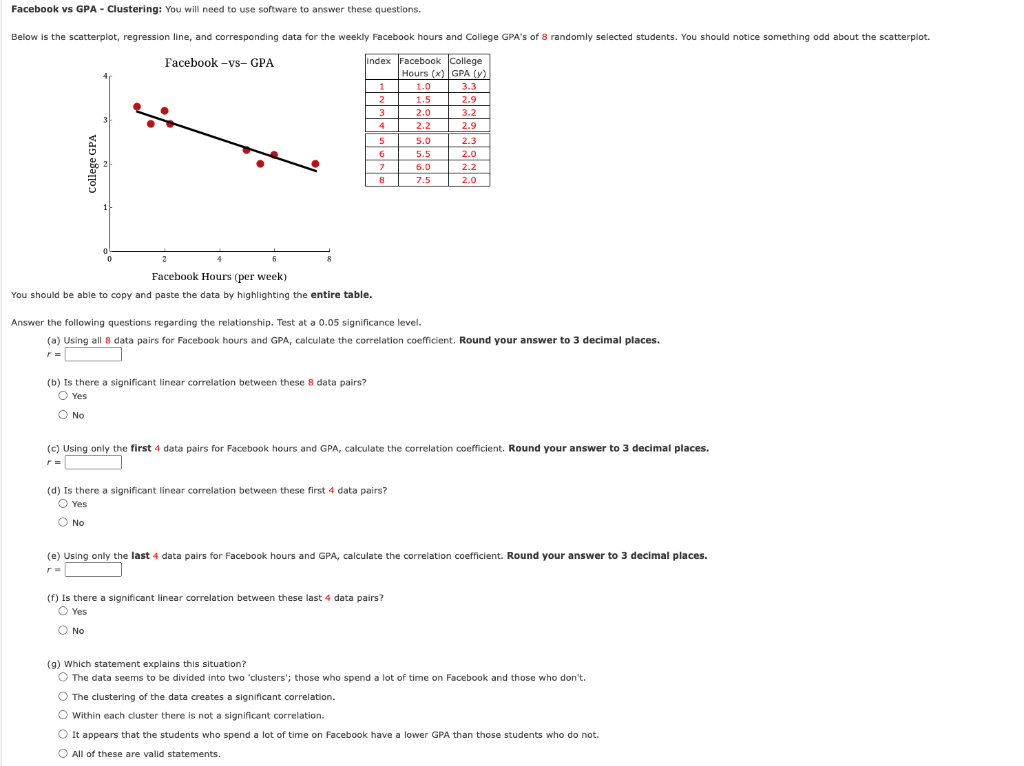
Facebook vs GPA - Clustering: You will need to use software to answer these questions. Below is the scatterplot, regression line, and corresponding data for the weekly Facebook hours and College GPA's of 8 randomly selected students. You should notice something odd about the scatterplot. Facebook -VS- GPA Index Facebook College Hours (x) GPA (7) V 1 1.0 3.3 2 1.5 2.9 3 2.0 3.2 4 2.2 2.9 5 5.0 2.3 6 5.5 2.0 7 6.0 2.2 8 7.5 2.0 College GPA 0 0 2 Facebook Hours (per week) You should be able to copy and paste the data by highlighting the entire table. Answer the following questions regarding the relationship. Test at a 0.05 significance level. (a) Using all 8 data pairs for Facebook hours and GPA, calculate the correlation coefficient. Round your answer to 3 decimal places. a, . r= (b) Is there a significant linear correlation between these 8 data pairs? Yes O No (c) Using only the first 4 data pairs for Facebook hours and GPA, calculate the correlation coefficient. Round your answer to 3 decimal places. (d) Is there a significant linear correlation between these first 4 data pairs? Yes O No (e) Using only the last 4 data pairs for Facebook hours and GPA, calculate the correlation coefficient. Round your answer to 3 decimal places. (. (f) Is there a significant linear correlation between these last 4 data pairs? Yes O No (9) Which statement explains this situation? The data seems to be divided into two "clusters'; those who spend a lot of time on Facebook and those who don't The clustering of the data creates a significant correlation. Within each cluster there is not a significant correlation. It appears that the students who spend a lot of time on Facebook have a lower GPA than those students who do not. O All of these are valid statements.