Page 1 of 1
Here is data with y as the response variable. X у 39.3 30.9 -121 168.7 61.3 7.8 28.2 30.8 24.7 45.5 20.8 39.6 31.2 23.9
Posted: Wed Dec 08, 2021 5:25 am
by answerhappygod
- 1 (67.1 KiB) Viewed 148 times
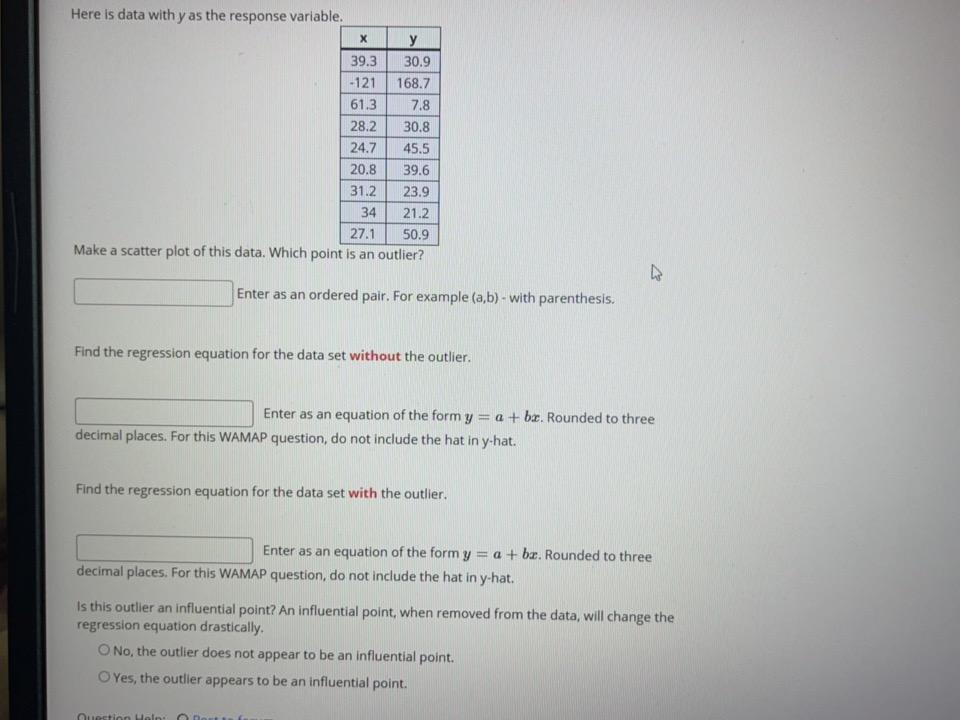
Here is data with y as the response variable. X у 39.3 30.9 -121 168.7 61.3 7.8 28.2 30.8 24.7 45.5 20.8 39.6 31.2 23.9 34 21.2 27.1 50.9 Make a scatter plot of this data. Which point is an outlier? D Enter as an ordered pair. For example (a,b) - with parenthesis. Find the regression equation for the data set without the outlier. Enter as an equation of the form y = a + bæ. Rounded to three decimal places. For this WAMAP question, do not include the hat in y-hat. Find the regression equation for the data set with the outlier. Enter as an equation of the form y = a + ba. Rounded to three decimal places. For this WAMAP question, do not include the hat in y-hat. Is this outlier an influential point? An influential point, when removed from the data, will change the regression equation drastically O No, the outlier does not appear to be an influential point. O Yes, the outlier appears to be an influential point. Question Help