Page 1 of 1
Write a function graph_xyz (filename) which takes a filename (a csv file) which contains columns for X, Y and Z directio
Posted: Fri Jun 10, 2022 11:55 am
by correctanswer
- Write A Function Graph Xyz Filename Which Takes A Filename A Csv File Which Contains Columns For X Y And Z Directio 1 (144.99 KiB) Viewed 73 times
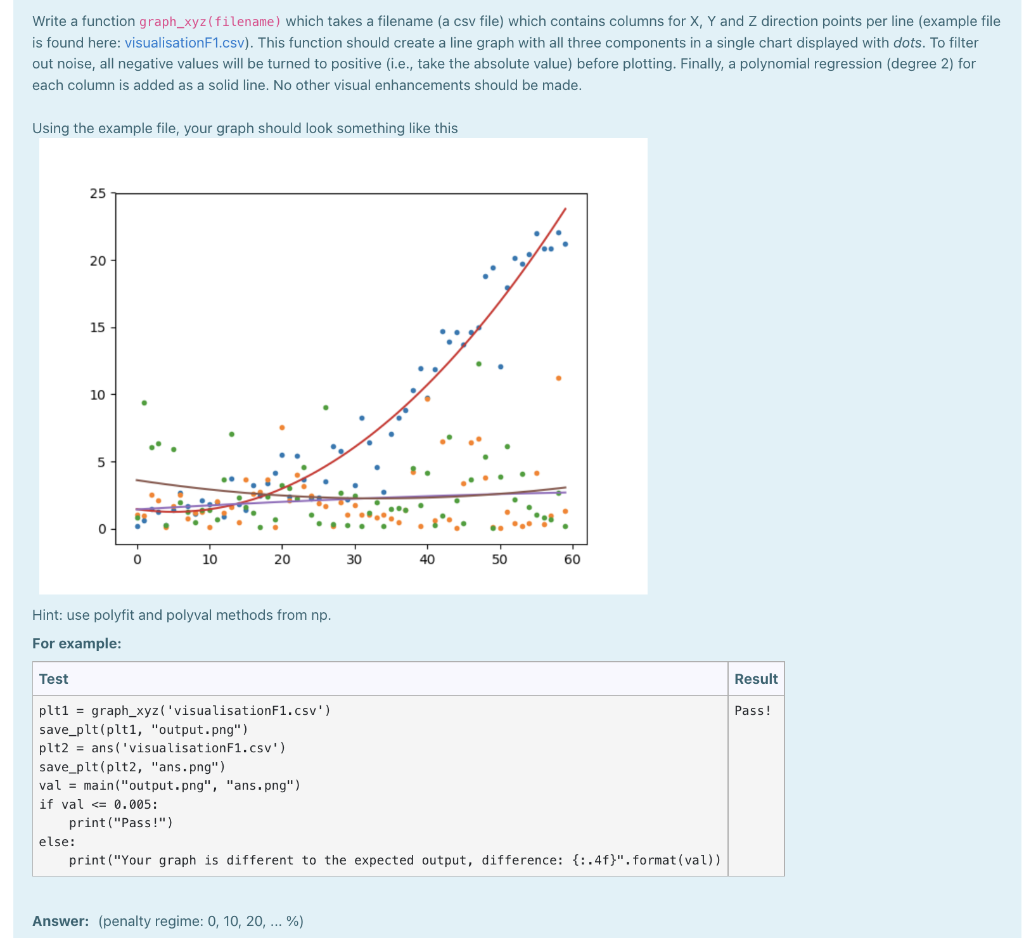
Write a function graph_xyz (filename) which takes a filename (a csv file) which contains columns for X, Y and Z direction points per line (example file is found here: visualisationF1.csv). This function should create a line graph with all three components in a single chart displayed with dots. To filter out noise, all negative values will be turned to positive (i.e., take the absolute value) before plotting. Finally, a polynomial regression (degree 2) for each column is added as a solid line. No other visual enhancements should be made. Using the example file, your graph should look something like this 25 20 15 10 0 0 10 20 30 40 50 60 Hint: use polyfit and polyval methods from np. For example: Test Result plt1= graph_xyz ('visualisationF1.csv') Pass! save_plt (plt1, "output.png") plt2 = ans('visualisationF1.csv') save_plt (plt2, "ans.png") val= main("output.png", "ans.png") if val < 0.005: print("Pass!") else: print("Your graph is different to the expected output, difference: {:.4f}". format (val)) Answer: (penalty regime: 0, 10, 20, ... %)