Page 1 of 1
Intro to Stat I (STAT-145) Day 4: Measures of Center & Spread 4. The histogram and numerical summaries shown below repre
Posted: Sun Sep 05, 2021 5:09 pm
by answerhappygod
- Intro To Stat I Stat 145 Day 4 Measures Of Center Spread 4 The Histogram And Numerical Summaries Shown Below Repre 1 (49.93 KiB) Viewed 628 times
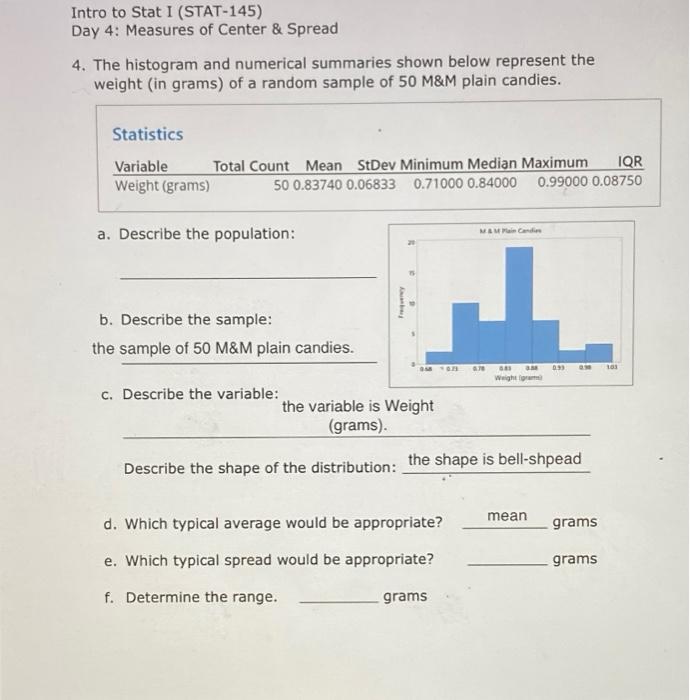
Intro to Stat I (STAT-145) Day 4: Measures of Center & Spread 4. The histogram and numerical summaries shown below represent the weight (in grams) of a random sample of 50 M&M plain candies. Statistics Variable Total Count Mean StDev Minimum Median Maximum IQR Weight (grams) 50 0.83740 0.06833 0.71000 0.84000 0.99000 0.08750 M&M and a. Describe the population: b. Describe the sample: the sample of 50 M&M plain candies. OF 093 Weight c. Describe the variable: the variable is Weight (grams) Describe the shape of the distribution: the shape is bell-shpead mean grams d. Which typical average would be appropriate? e. Which typical spread would be appropriate? grams f. Determine the range. grams