Page 1 of 1
2. The graph below depicts allele frequencies over time for one locus under both selection and mutation in a population.
Posted: Thu Jun 09, 2022 12:05 pm
by answerhappygod
- 2 The Graph Below Depicts Allele Frequencies Over Time For One Locus Under Both Selection And Mutation In A Population 1 (51.29 KiB) Viewed 223 times
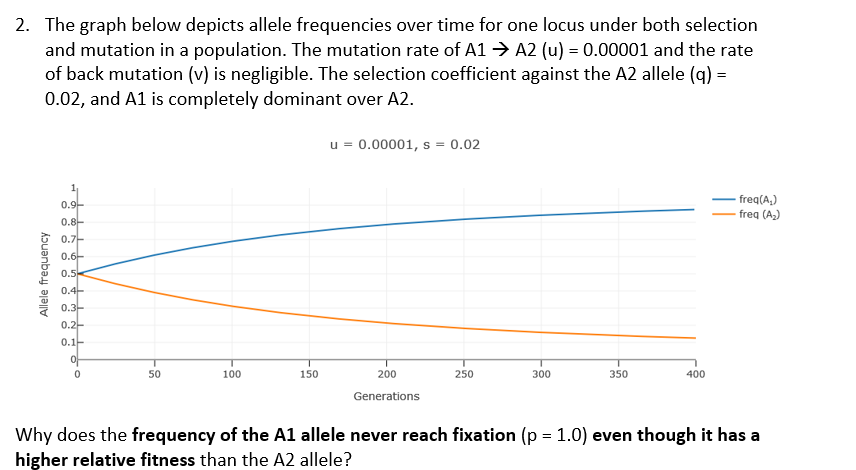
2. The graph below depicts allele frequencies over time for one locus under both selection and mutation in a population. The mutation rate of A1 A2 (u) = 0.00001 and the rate of back mutation (v) is negligible. The selection coefficient against the A2 allele (q) = 0.02, and A1 is completely dominant over A2. u = 0.00001, s = 0.02 1, 0.9- freq(A₂) freq (A₂) 0.8- 0.7- 0.6 0.5 0.4- 0.3- 0.2- 0.1- of T 300 350 250 400 0 50 100 150 200 Generations Why does the frequency of the A1 allele never reach fixation (p = 1.0) even though it has a higher relative fitness than the A2 allele? Allele frequency