Page 1 of 1
Questions 1. The graph below depicts allele frequencies over time for one locus under mutation in a population. The muta
Posted: Thu Jun 09, 2022 12:04 pm
by answerhappygod
- Questions 1 The Graph Below Depicts Allele Frequencies Over Time For One Locus Under Mutation In A Population The Muta 1 (39.57 KiB) Viewed 229 times
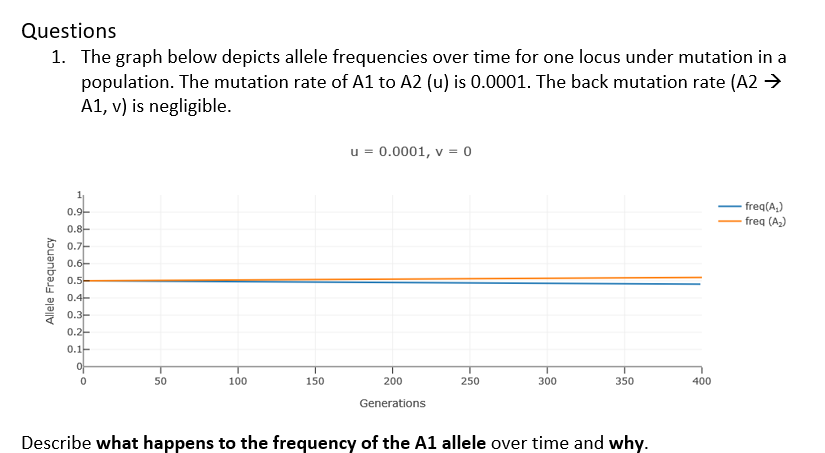
Questions 1. The graph below depicts allele frequencies over time for one locus under mutation in a population. The mutation rate of A1 to A2 (u) is 0.0001. The back mutation rate (A2 → A1, v) is negligible. u = 0.0001, v = 0 1 0.9- freq(A₂) freq (A₂) 0.8 0.7- 0.6- 0.5- 0.4- 0.3- 0.2- 0.1- of 0 50 100 150 250 300 350 400 200 Generations Describe what happens to the frequency of the A1 allele over time and why. Allele Frequency