Page 1 of 1
1. For the following data, submit a scatterplot. x: 10 5 13 6 15 13 4 3 12 10 16 18 11 16 4 13 4 16 14 15 y: -8 1-17 -3
Posted: Sun Sep 05, 2021 5:09 pm
by answerhappygod
- 1 For The Following Data Submit A Scatterplot X 10 5 13 6 15 13 4 3 12 10 16 18 11 16 4 13 4 16 14 15 Y 8 1 17 3 1 (65.14 KiB) Viewed 728 times
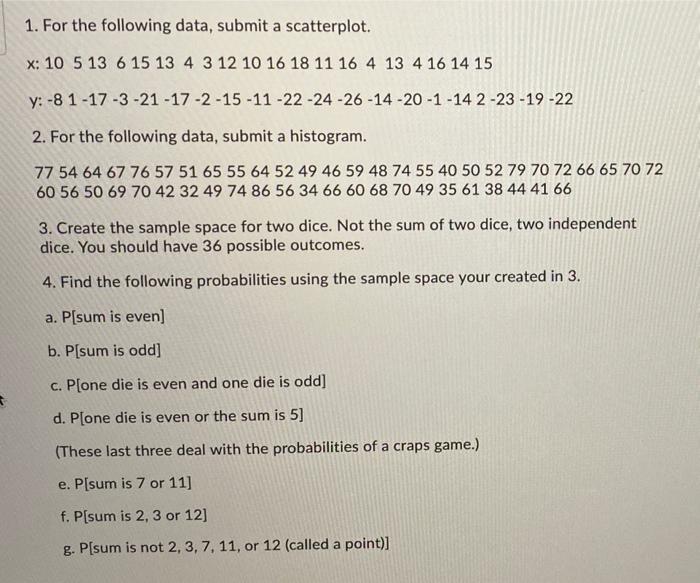
1. For the following data, submit a scatterplot. x: 10 5 13 6 15 13 4 3 12 10 16 18 11 16 4 13 4 16 14 15 y: -8 1-17 -3 -21 -17-2-15-11-22-24-26 -14 -20 -1 -142-23 -19-22 2. For the following data, submit a histogram. 77 54 64 67 76 57 51 65 55 64 52 49 46 59 48 74 55 40 50 52 79 70 72 66 65 70 72 60 56 50 69 70 42 32 49 74 86 56 34 66 60 68 70 49 35 61 38 44 41 66 3. Create the sample space for two dice. Not the sum of two dice, two independent dice. You should have 36 possible outcomes. 4. Find the following probabilities using the sample space your created in 3. a. P[sum is even] b. P[sum is odd] c. P[one die is even and one die is odd] d. P[one die is even or the sum is 5] (These last three deal with the probabilities of a craps game.) e. P[sum is 7 or 11] f. Písum is 2, 3 or 12] g. P[sum is not 2, 3, 7, 11, or 12 (called a point)]