Page 1 of 1
i. Given the unity feedback system of Figure 2.2 with: G(s) a. Plot the Bode diagram of G(s) using asymptotes. b. Find t
Posted: Tue Jun 07, 2022 12:42 pm
by answerhappygod
- I Given The Unity Feedback System Of Figure 2 2 With G S A Plot The Bode Diagram Of G S Using Asymptotes B Find T 1 (95.55 KiB) Viewed 40 times
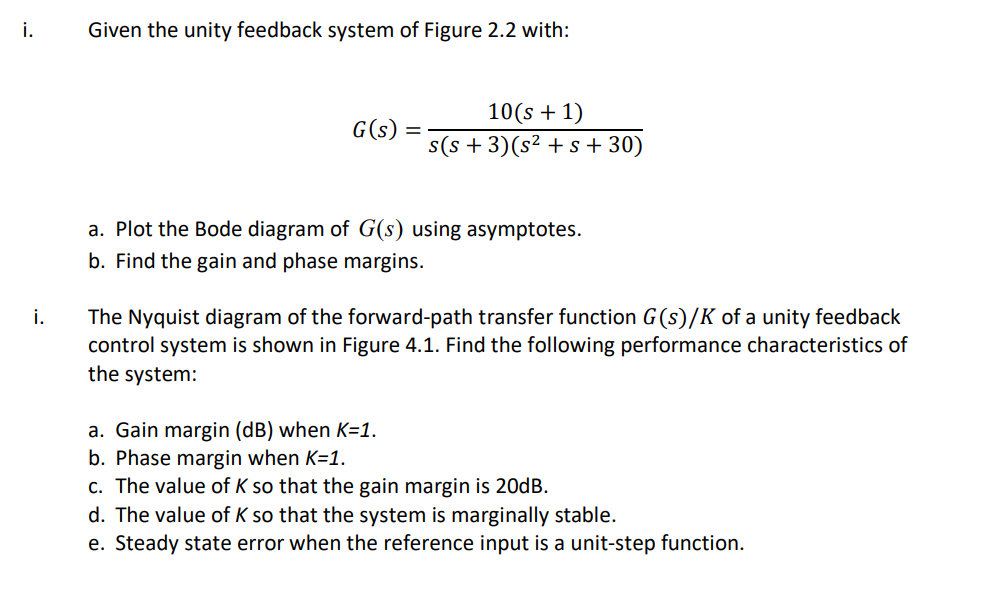
i. Given the unity feedback system of Figure 2.2 with: G(s) a. Plot the Bode diagram of G(s) using asymptotes. b. Find the gain and phase margins. i. The Nyquist diagram of the forward-path transfer function G(s)/K of a unity feedback control system is shown in Figure 4.1. Find the following performance characteristics of the system: a. Gain margin (dB) when K=1. b. Phase margin when K=1. c. The value of K so that the gain margin is 20dB. d. The value of K so that the system is marginally stable. e. Steady state error when the reference input is a unit-step function. = 10(s + 1) s(s+3)(s² + s + 30)
Imaginary Axis 1 0.8 0.6 0.4 0.2 O -0.2 -0.4 -0.6 -0.8 -1 + -1 -0.8 -0.6 Nyquist Diagram W -0.4 -0.2 Figure 4.1 0 0.2 0.4 0.6 Real Axis 0.8 1