Page 1 of 1
The Nyquist diagram of the forward-path transfer function G(s)/K of a unity feedback control system is shown in Figure 4
Posted: Tue Jun 07, 2022 12:38 pm
by answerhappygod
- The Nyquist Diagram Of The Forward Path Transfer Function G S K Of A Unity Feedback Control System Is Shown In Figure 4 1 (33.44 KiB) Viewed 46 times
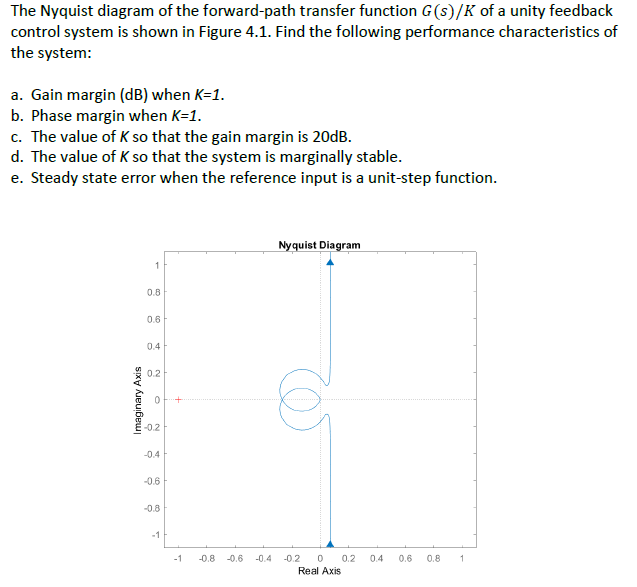
The Nyquist diagram of the forward-path transfer function G(s)/K of a unity feedback control system is shown in Figure 4.1. Find the following performance characteristics of the system: a. Gain margin (dB) when K=1. b. Phase margin when K=1. c. The value of K so that the gain margin is 20dB. d. The value of K so that the system is marginally stable. e. Steady state error when the reference input is a unit-step function. Nyquist Diagram 1 0.8 0.6 0.4 0.2 -0.2 0 0.2 0.4 Real Axis Imaginary Axis 0 -0.2 -0.4 -0.6 -0.8 -1 + -1 -0.8 -0.6 -0.4 0.6 0.8 1