Page 1 of 1
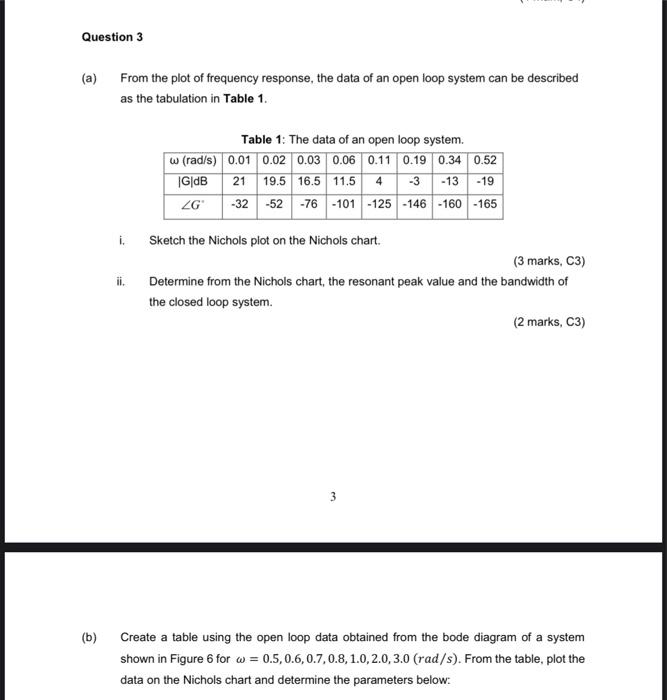
Question 3 (a) From the plot of frequency response, the data of an open loop system can be described as the tabulation i
Posted: Tue Jun 07, 2022 12:38 pm
by answerhappygod
- Question 3 A From The Plot Of Frequency Response The Data Of An Open Loop System Can Be Described As The Tabulation I 1 (40.23 KiB) Viewed 55 times
Question 3 (a) From the plot of frequency response, the data of an open loop system can be described as the tabulation in Table 1. Table 1: The data of an open loop system. w (rad/s) 0.01 0.02 0.03 0.06 0.11 0.19 0.34 0.52 |G|dB 21 19.5 16.5 11.5 4 -3 -13 -19 ZG -32 -52-76 -101 -125 -146-160-165 i. Sketch the Nichols plot on the Nichols chart. (3 marks, C3) ii. Determine from the Nichols chart, the resonant peak value and the bandwidth of the closed loop system. (2 marks, C3) (b) Create a table using the open loop data obtained from the bode diagram of a system shown in Figure 6 for w=0.5, 0.6,0.7,0.8, 1.0, 2.0, 3.0 (rad/s). From the table, plot the data on the Nichols chart and determine the parameters below: