Page 1 of 1
A baseband signal m(t) is the periodic sawtooth signal shown in Fig. P1.1, given wc = 2 x 10⁶. (a) Sketch PFM (t) for m(
Posted: Tue Jun 07, 2022 10:29 am
by answerhappygod
- A Baseband Signal M T Is The Periodic Sawtooth Signal Shown In Fig P1 1 Given Wc 2 X 10⁶ A Sketch Pfm T For M 1 (110.55 KiB) Viewed 26 times
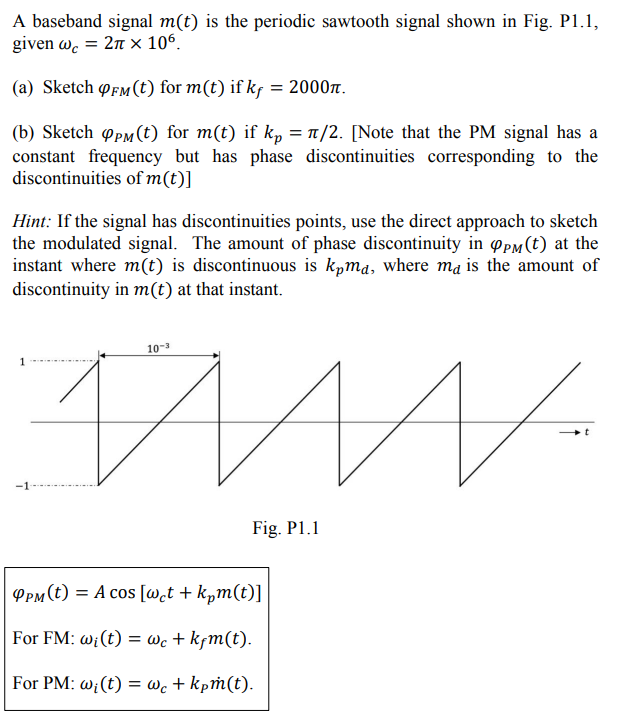
A baseband signal m(t) is the periodic sawtooth signal shown in Fig. P1.1, given wc = 2 x 10⁶. (a) Sketch PFM (t) for m(t) if kƒ = 2000. (b) Sketch PPM (t) for m(t) if kp = π/2. [Note that the PM signal has a constant frequency but has phase discontinuities corresponding to the discontinuities of m(t)] Hint: If the signal has discontinuities points, use the direct approach to sketch the modulated signal. The amount of phase discontinuity in OPM (t) at the instant where m(t) is discontinuous is kpma, where ma is the amount of discontinuity in m(t) at that instant. 10-3 1 IN t -1 Fig. P1.1 PPM (t) = A cos [wet + kpm(t)] For FM: wi(t) = wc + kfm(t). For PM: wi(t) = wc + kpm(t).