Page 1 of 1
Instructions: The table below shows income (in thousands of dollars) from sales of a particular product over a four week
Posted: Sun Jun 05, 2022 10:26 pm
by answerhappygod
- Instructions The Table Below Shows Income In Thousands Of Dollars From Sales Of A Particular Product Over A Four Week 1 (35.8 KiB) Viewed 58 times
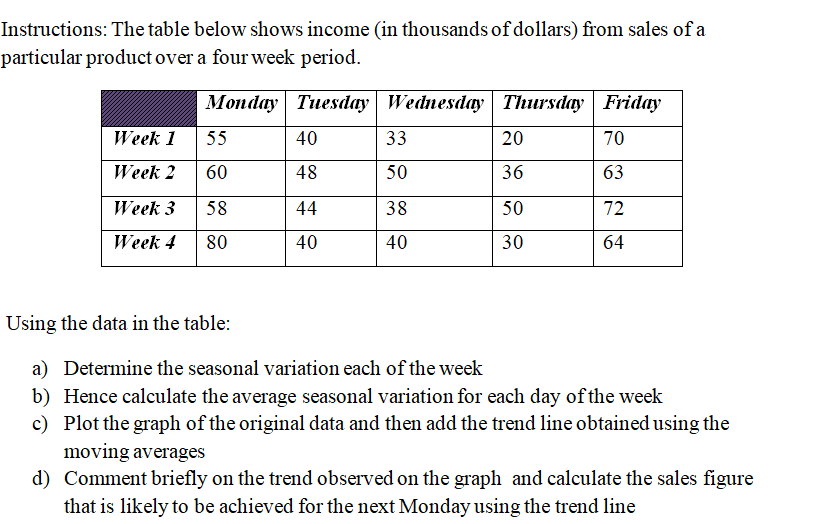
Instructions: The table below shows income (in thousands of dollars) from sales of a particular product over a four week period. Monday Tuesday Wednesday Thursday Friday Week 1 55 40 33 20 70 Week 2 60 48 50 36 63 Week 3 58 44 38 50 72 Week 4 80 40 40 30 64 Using the data in the table: a) Determine the seasonal variation each of the week b) Hence calculate the average seasonal variation for each day of the week c) Plot the graph of the original data and then add the trend line obtained using the moving averages d) Comment briefly on the trend observed on the graph and calculate the sales figure that is likely to be achieved for the next Monday using the trend line