- 7 40 Pm Fri Jun 3 86 L Moodle Nait Ca Login Mynait In Cmis2250 1213 0a01 X N Moodle Nait Ca Plugi C Sign In O 1 (222.63 KiB) Viewed 89 times
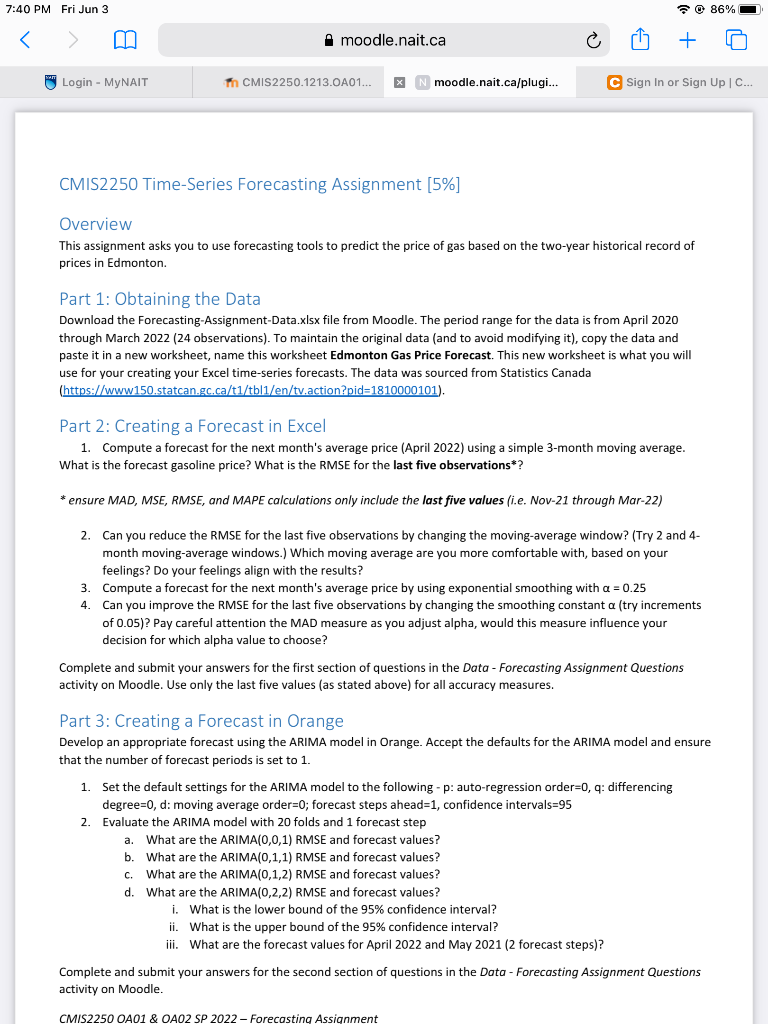
7:40 PM Fri Jun 3 86% L moodle.nait.ca + Login - MyNAIT in CMIS2250.1213.0A01... x N moodle.nait.ca/plugi... C Sign In or Sign Up | C... CMIS2250 Time-Series Forecasting Assignment [5%] Overview This assignment asks you to use forecasting tools to predict the price of gas based on the two-year historical record of prices in Edmonton. Part 1: Obtaining the Data Download the Forecasting-Assignment-Data.xlsx file from Moodle. The period range for the data is from April 2020 through March 2022 (24 observations). To maintain the original data (and to avoid modifying it), copy the data and paste it in a new worksheet, name this worksheet Edmonton Gas Price Forecast. This new worksheet is what you will use for your creating your Excel time-series forecasts. The data was sourced from Statistics Canada (
https://www150.statcan.gc.ca/t1/tbl1/en ... 1810000101). Part 2: Creating a Forecast in Excel 1. Compute a forecast for the next month's average price (April 2022) using a simple 3-month moving average. What is the forecast gasoline price? What is the RMSE for the last five observations*? * ensure MAD, MSE, RMSE, and MAPE calculations only include the last five values (i.e. Nov-21 through Mar-22) 2. Can you reduce the RMSE for the last five observations by changing the moving-average window? (Try 2 and 4- month moving-average windows.) Which moving average are you more comfortable with, based on your feelings? Do your feelings align with the results? 3. Compute a forecast for the next month's average price by using exponential smoothing with a = 0.25 4. Can you improve the RMSE for the last five observations by changing the smoothing constant a (try increments of 0.05)? Pay careful attention the MAD measure as you adjust alpha, would this measure influence your decision for which alpha value to choose? Complete and submit your answers for the first section of questions in the Data - Forecasting Assignment Questions activity on Moodle. Use only the last five values (as stated above) for all accuracy measures. Part 3: Creating a Forecast in Orange Develop an appropriate forecast using the ARIMA model in Orange. Accept the defaults for the ARIMA model and ensure that the number of forecast periods is set to 1. 1 Set the default settings for the ARIMA model to the following -p: auto-regression order=0, q: differencing degree=0, d: moving average order=0; forecast steps ahead=1, confidence intervals=95 Evaluate the ARIMA model with 20 folds and 1 forecast step 2. a. What are the ARIMA(0,0,1) RMSE and forecast values? b. What are the ARIMA(0,1,1) RMSE and forecast values? c. What ARIMA(0,1,2) RMSE and forecast values? d. What are the ARIMA(0,2,2) RMSE and forecast values? i. What is the lower bound of the 95% confidence interval? ii. What is the upper bound of the 95% confidence interval? iii. What are the forecast values for April 2022 and May 2021 (2 forecast steps)? Complete and submit your answers for the second section of questions in the Data - Forecasting Assignment Questions activity on Moodle. CMIS2250 OA01 & OA02 SP 2022- Forecasting Assignment