Page 1 of 1
You are the product manager for wireless headphones and your company has the exclusive license of the product. The compa
Posted: Sun Jun 05, 2022 4:24 pm
by answerhappygod
- You Are The Product Manager For Wireless Headphones And Your Company Has The Exclusive License Of The Product The Compa 1 (38.46 KiB) Viewed 52 times
- You Are The Product Manager For Wireless Headphones And Your Company Has The Exclusive License Of The Product The Compa 2 (10.75 KiB) Viewed 52 times
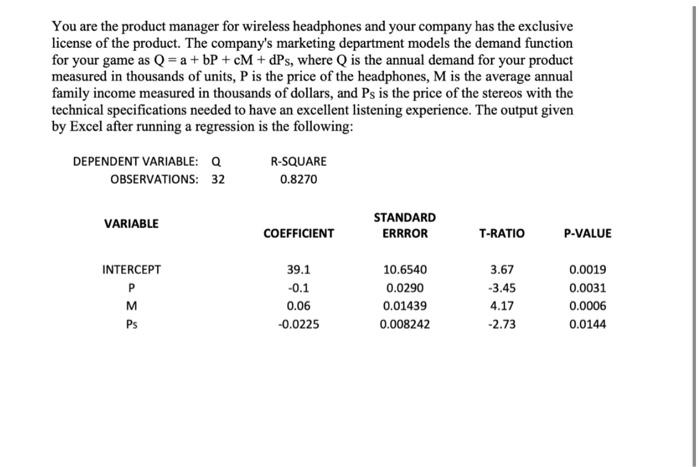
You are the product manager for wireless headphones and your company has the exclusive license of the product. The company's marketing department models the demand function for your game as Q = a +bP + cM +dPs, where Q is the annual demand for your product measured in thousands of units, P is the price of the headphones, M is the average annual family income measured in thousands of dollars, and Ps is the price of the stereos with the technical specifications needed to have an excellent listening experience. The output given by Excel after running a regression is the following: DEPENDENT VARIABLE: Q OBSERVATIONS: 32 R-SQUARE 0.8270 VARIABLE STANDARD ERRROR COEFFICIENT T-RATIO P-VALUE INTERCEPT 39.1 10.6540 3.67 0.0019 P -0.1 0.0290 -3.45 0.0031 M 0.06 0.01439 4.17 0.0006 Ps -0.0225 0.008242 -2.73 0.0144
5. (10 pts.) Draw an accurate graph (ideally use a computer to do so) showing market demand, marginal revenue, and the area representing your total revenue.