Page 1 of 1
Problem 1: Trip Generation (25 marks) In order to understand the travel impacts associated with the Starcourt Mall expan
Posted: Thu Jun 02, 2022 10:44 am
by answerhappygod
- Problem 1 Trip Generation 25 Marks In Order To Understand The Travel Impacts Associated With The Starcourt Mall Expan 1 (66.94 KiB) Viewed 46 times
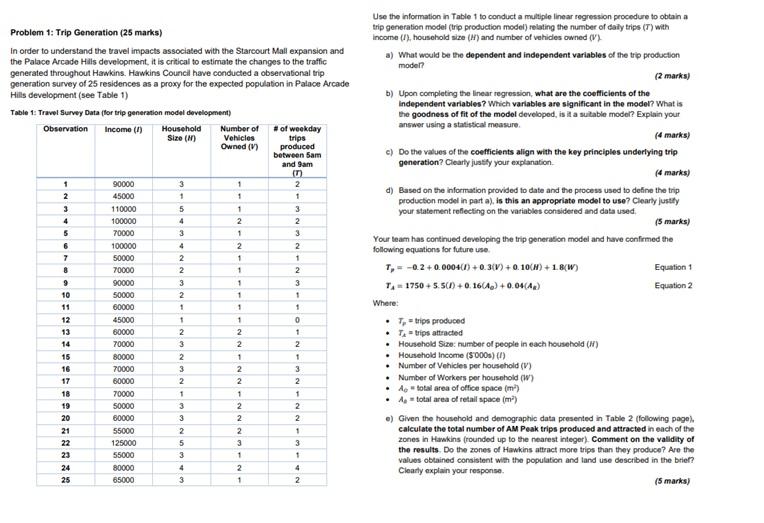
Problem 1: Trip Generation (25 marks) In order to understand the travel impacts associated with the Starcourt Mall expansion and the Palace Arcade Hills development, it is critical to estimate the changes to the traffic generated throughout Hawkins. Hawkins Council have conducted a observational trip generation survey of 25 residences as a proxy for the expected population in Palace Arcade Hills development (see Table 1) Table 1: Travel Survey Data (for trip generation model development) Observation Income (1) Household Size (M) Number of Vehicles Owned (V) # of weekday trips produced between 5am and 9am (7) 1 90000 3 1 2 2 1 1 45000 110000 3 3 100000 2 70000 100000 50000 70000 90000 50000 60000 45000 60000 70000 80000 70000 60000 70000 50000 60000 55000 125000 55000 80000 65000 *3======== 10 12 13 14 15 16 17 18 19 20 21 22 23 24 25 5 4 3 4 2 2 3 2 1 1 2 3 2 3 2 1 3 3 2 5 3 4 3 1 1 2 1 2 1 1 1 1 1 1 2 2 1 2 NN 2 1 2 -~-WNNN 2 2 3 1 2 1 3 2 1 2 3 1 1 0 1 2 1 3 2 1 2 2 1 3 1 4 2 Use the information in Table 1 to conduct a multiple linear regression procedure to obtain a trip generation model (trip production model) relating the number of daily trips (7) with income (1), household size (H) and number of vehicles owned (V) a) What would be the dependent and independent variables of the trip production model? (2 marks) b) Upon completing the linear regression, what are the coefficients of the independent variables? Which variables are significant in the model? What is the goodness of fit of the model developed, is it a suitable model? Explain your answer using a statistical measure. (4 marks) c) Do the values of the coefficients align with the key principles underlying trip generation? Clearly justify your explanation. (4 marks) d) Based on the information provided to date and the process used to define the trip production model in part a), is this an appropriate model to use? Clearly justify your statement reflecting on the variables considered and data used. (5 marks) Your team has continued developing the trip generation model and have confirmed the following equations for future use. T, = -0.2 +0.0004(1) + 0.3(V) + 0.10(N) +1.8(W) Equation 1 Equation 2 T₁ = 1750 +5.5(1) + 0.16 (4₂) +0.04 (4) Where: •T-trips produced • T-trips attracted • Household Size: number of people in each household (W) • Household Income ($000) (/) • Number of Vehicles per household (V) • Number of Workers per household (W) • A total area of office space (m²) • A total area of retail space (m²) e) Given the household and demographic data presented in Table 2 (following page), calculate the total number of AM Peak trips produced and attracted in each of the zones in Hawkins (rounded up to the nearest integer). Comment on the validity of the results. Do the zones of Hawkins attract more trips than they produce? Are the values obtained consistent with the population and land use described in the brief? Clearly explain your response. (5 marks)