- B Voltage And Current In Series Rc And Rlc Circuit 1 Build The Circuit Of Figure 20 9a Using R 1 K0 And C 10 Nf P 1 (439.37 KiB) Viewed 29 times
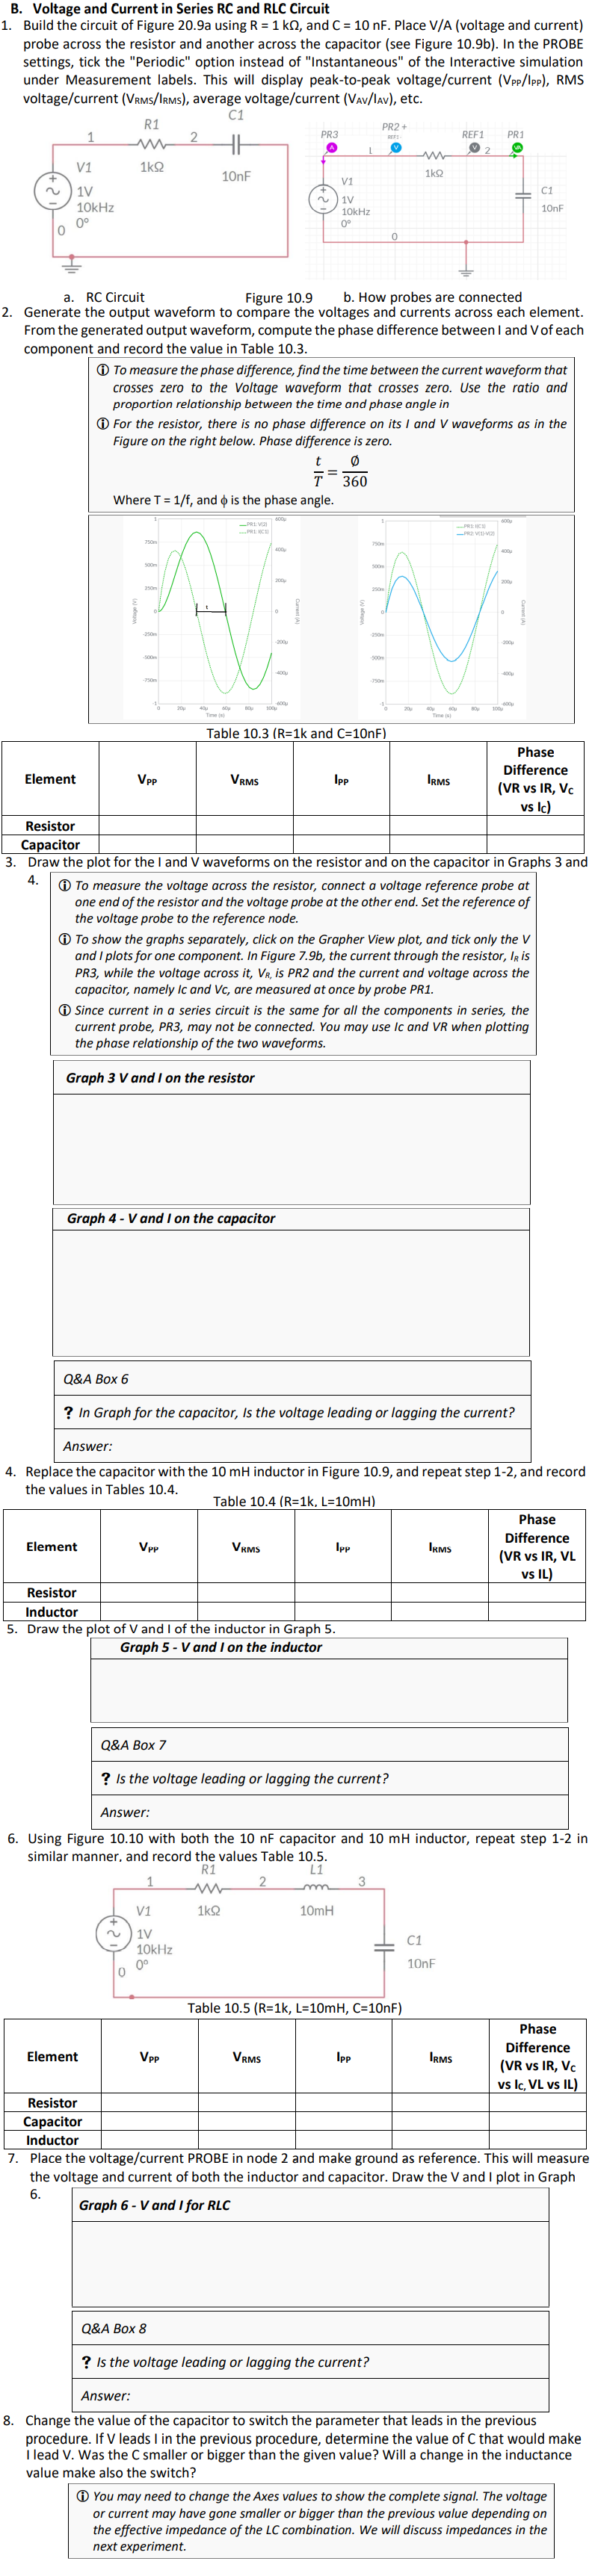
B. Voltage and Current in Series RC and RLC Circuit 1. Build the circuit of Figure 20.9a using R = 1 k0, and C= 10 nF. Place V/A (voltage and current) probe across the resistor and another across the capacitor (see Figure 10.9b). In the PROBE settings, tick the "Periodic" option instead of "Instantaneous" of the Interactive simulation under Measurement labels. This will display peak-to-peak voltage/current (VPP/Ipp), RMS voltage/current (VRMS/IRMS), average voltage/current (VAV/lAV), etc. C1 R1 PR2+ 1 2 PR3 REF1- REF1 PR1 1kQ + 10nF V1 V1 1V C1 1V 10kHz 10nF 10kHz 0° 0 0 a. RC Circuit Figure 10.9 b. How probes are connected 2. Generate the output waveform to compare the voltages and currents across each element. From the generated output waveform, compute the phase difference between I and V of each component and record the value in Table 10.3. To measure the phase difference, find the time between the current waveform that crosses zero to the Voltage waveform that crosses zero. Use the ratio and proportion relationship between the time and phase angle in For the resistor, there is no phase difference on its I and V waveforms as in the Figure on the right below. Phase difference is zero. t 0 = 360 Where T = 1/f, and is the phase angle. 600μ 600μ -PR1: V(2) ..... PR1: I(C1) PR1: C11 -PR2: V(1)-(2) 750m 750m 400 400μ 500m 200p 250m t 0 -250m -200μ -400μ -750m -750m 600μ -600μ 80 60p Time (s) 40μ Time (s) Table 10.3 (R=1k and C=10nF) Element Vpp VRMS Ipp IRMS Phase Difference (VR vs IR, Vc vs Ic) Resistor Capacitor 3. Draw the plot for the I and V waveforms on the resistor and on the capacitor in Graphs 3 and 4. To measure the voltage across the resistor, connect a voltage reference probe at one end of the resistor and the voltage probe at the other end. Set the reference of the voltage probe to the reference node. To show the graphs separately, click on the Grapher View plot, and tick only the V and I plots for one component. In Figure 7.9b, the current through the resistor, IR is PR3, while the voltage across it, VR, is PR2 and the current and voltage across the capacitor, namely Ic and Vc, are measured at once by probe PR1. Since current in a series circuit is the same for all the components in series, the current probe, PR3, may not be connected. You may use Ic and VR when plotting the phase relationship of the two waveforms. Graph 3 V and I on the resistor Graph 4 - V and I on the capacitor Q&A Box 6 ? In Graph for the capacitor, Is the voltage leading or lagging the current? Answer: 4. Replace the capacitor with the 10 mH inductor in Figure 10.9, and repeat step 1-2, and record the values in Tables 10.4. Table 10.4 (R=1k, L=10mH) Element VPP VRMS Ipp IRMS Phase Difference (VR vs IR, VL vs IL) Resistor Inductor 5. Draw the plot of V and I of the inductor in Graph 5. Graph 5-V and I on the inductor Q&A Box 7 ? Is the voltage leading or lagging the current? Answer: 6. Using Figure 10.10 with both the 10 nF capacitor and 10 mH inductor, repeat step 1-2 in similar manner, and record the values Table 10.5. R1 L1 1 2 3 1k92 10mH C1 10nF Table 10.5 (R=1k, L=10mH, C=10nF) Phase Difference (VR vs IR, Vc Element VPP VRMS Ipp IRMS vs Ic, VL vs IL) Resistor Capacitor Inductor 7. Place the voltage/current PROBE in node 2 and make ground as reference. This will measure the voltage and current of both the inductor and capacitor. Draw the V and I plot in Graph Graph 6-V and I for RLC 6. Q&A Box 8 ? Is the voltage leading or lagging the current? Answer: 8. Change the value of the capacitor to switch the parameter that leads in the previous procedure. If V leads I in the previous procedure, determine the value of C that would make I lead V. Was the C smaller or bigger than the given value? Will a change in the inductance value make also the switch? You may need to change the Axes values to show the complete signal. The voltage or current may have gone smaller or bigger than the previous value depending on the effective impedance of the LC combination. We will discuss impedances in the next experiment. V1 ~ 1V 10kHz 0⁰ 0 20μ L ~ 20 1k92 BOU 100μ