Page 1 of 1
Lillian Fok, a New Orleans psychologist, specializes in treating patients who are agoraphobic (ie, afraid to leave their
Posted: Mon May 30, 2022 4:29 pm
by answerhappygod
- Lillian Fok A New Orleans Psychologist Specializes In Treating Patients Who Are Agoraphobic Ie Afraid To Leave Their 1 (35.65 KiB) Viewed 39 times
- Lillian Fok A New Orleans Psychologist Specializes In Treating Patients Who Are Agoraphobic Ie Afraid To Leave Their 2 (43.29 KiB) Viewed 39 times
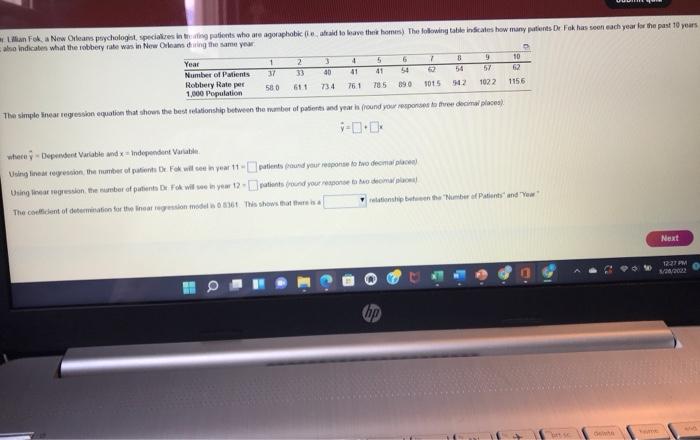
Lillian Fok, a New Orleans psychologist, specializes in treating patients who are agoraphobic (ie, afraid to leave their homes) The following table indicates how many patients Dr Fok has seen each year for the past 10 years also indicates what the robbery rate was in New Orleans driving the same year Year 1 3 2 6 10 7 8 9 5 4 41 41 33 54 62 57 62 Number of Patients Robbery Rate per 1,000 Population 31 58.0 40 734 76.1 61.1 78.5 89.0 101.5 542 1022 1156 The simple linear regression equation that shows the best relationship between the member of patients and year is (round your responses to three decimal places) -0.0* where-Dependent Variable and x Independent Variable Using linear regression, the number of patients De Fok will see in year 11-patients (round your response to two decimal places) Using linear regression, the number of patients Dr Fok will see in year 12-patients (round your response to two decimal places) The coefficient of determination for the Inear regression model is 08361. This shows that there is a relationship between the Number of Patients and Yea Next 12:27 PM 3/20/2022 hp w by sc Gewha tame
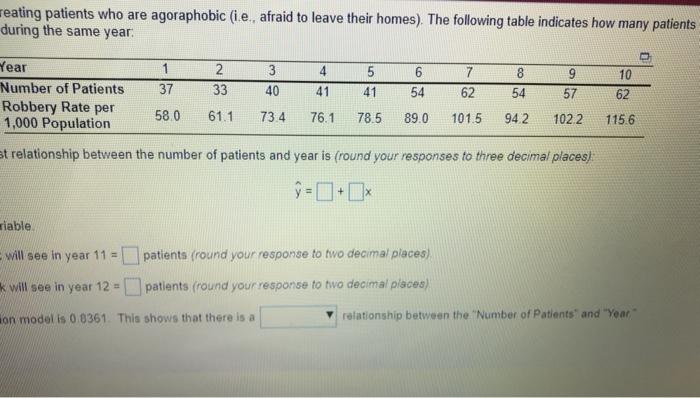
reating patients who are agoraphobic (i.e., afraid to leave their homes). The following table indicates how many patients during the same year. Year 1 2 3 4 5 6 7 8 9 10 Number of Patients 37 33 40 41 41 54 62 54 57 62 Robbery Rate per 1,000 Population 58.0 61.1 73.4 76.1 78.5 89.0 101.5 94.2 102.2 115.6 st relationship between the number of patients and year is (round your responses to three decimal places) ŷ=+x riable.. will see in year 11 = patients (round your response to two decimal places) will see in year 12 = patients (round your response to two decimal places) on model is 0.8361. This shows that there is a relationship between the "Number of Patients" and "Year"